The rally in NZD/USD is continuing strongly long after the RBNZ rate decision yesterday. Prices broke above the 0.80 resistance line and did not look back since. The most significant pullback occurred during early Asian session, with price pulling back and finding support around 0.806, hardly a significant pullback. Price recovered quickly higher as well, pushing back towards the trendline only to be rejected once more. However, this rejection does not seem to be permanent, with a bullish engulfing marubozu forming immediately, which opens up yet another opportunity for price to retest the trendline again – this time the target to hit would be 0.810 and beyond. Given the steep gradient of the trendline, and considering the overall short-term bullish momentum, it will not be surprising to see price being unable to climb above the trendline, but the ability to straddle trendline higher is a possibility. Hence do not simply treat the failure to break the trendline as a reversal signal. Traders may wish to seek further confirmation in order to ensure that they do not get in too early.
Hourly Chart
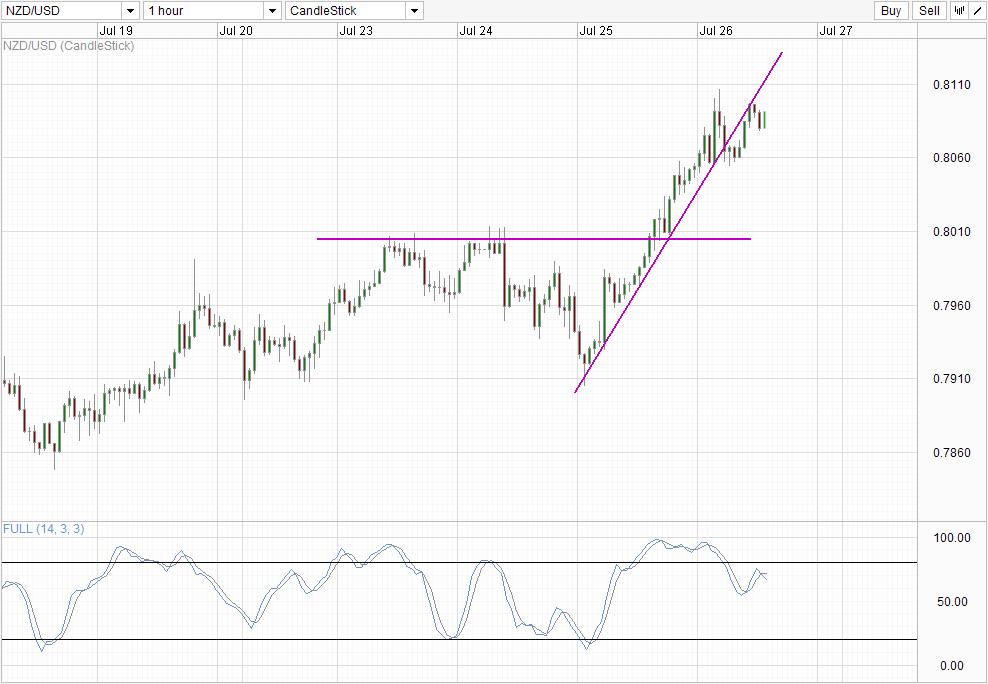
Stochastic readings from the Hourly Chart suggest that price is currently undergoing a bearish cycle. However, the divergence seen between Stoch peaks and Price peaks impairs the bearish signal heavily. In order for this bearish signal to be convincing, price should ideally clear 0.806 which will then open a move back towards 0.80. That in itself though is also not enough to invalidate current rally, with a break of 0.800 which opens up 0.790 necessary to occur before we can right off NZD/USD bullish.
Weekly Chart
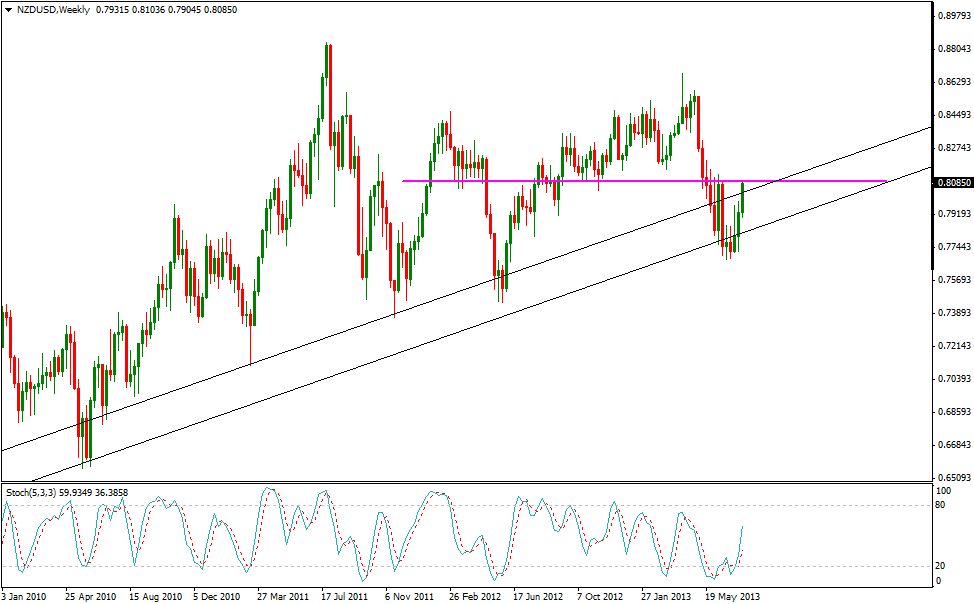
Weekly Chart shows a breakout of the multi-year support Channel. If price can end the week above 0.81, this will be the most bullish scenario we can ask for, with next week likely to continue in the bullish direction strongly. Even if we close below 0.81, but stay above the Channel Top, we will still have a 3 White Soldier bullish reversal candlestick pattern which coincide with a Channel Breakout, which is a strong bullish signal in itself. Stochastic readings are also pushing higher currently, yet we are still a good distance away from Overbought, which suggest that we could see at least around 2-3 weeks worth of rally before Stochastic readings hit Overbought.
Fundamentally, New Zealand’s economy is appearing to be picking up. Couple that with the never relenting Housing Bubble, RBNZ will have to allow rates to rally even though this would mean stronger Kiwi moving forward. Nonetheless, RBNZ’s will still try to push NZD lower by selling it via open market action. Hence if we see any temporary pullbacks, it is possible that pullbacks will be deeper and last longer that what you would normally expect. But even with these short-term pullback, the long-term bullish bias continue to remain on both technical and fundamental perspective, and a long-term push towards 0.88 may be possible once again.
More Links:
USD/SGD – Private Home Prices Rising Pushing SGD Higher
GBP/USD – Pushes to One Month High Above 1.54
AUD/USD – Makes Another Run at the Resistance Level at 0.93
This article is for general information purposes only. It is not investment advice or a solution to buy or sell securities. Opinions are the authors; not necessarily that of OANDA Corporation or any of its affiliates, subsidiaries, officers or directors. Leveraged trading is high risk and not suitable for all. You could lose all of your deposited funds.

Mingze Wu
Latest posts by Mingze Wu (see all)
- European Bourses Not Enjoying Bullish Winds From US Stocks - 17 April 2014
- More Aggressive Stimulus Possible Despite Premier Li’s Denial - 17 April 2014
- China March FDI -1.5% Y/Y vs +2.05% expected. First decline in more than a year. - 16 April 2014