- The odds have inched higher for a currency war scenario where the Chinese yuan may be weakened further to drive export growth due to its latest decelerating growth trend in China’s retail sales and persistent weak housing prices.
- Export-oriented countries may be forced to enact “beggar-thy-neighbour” typed monetary policies to deliberately weaken their respective currencies.
- A heightened currency war-liked scenario is likely to trigger another layer of US dollar strength.
- A persistent US dollar strength may not bode well for global stock markets in the medium term.
China’s domestic economy has continued to be in the doldrums as growth in retail sales for March decelerated significantly to 3.1% y/y from 5.5% y/y in February, its softest pace of gain since July 2023 and below consensus expectations of 4.5% which suggests that China’s consumer confidence has remained lackluster due to the year-long plus of deflationary risk spiral.
A persistently weak housing market supports the ongoing presence of deflationary pressures in China as the latest data of new home prices for March continued to tumble by 2.2% y/y, faster than a 1.4% y/y drop recorded in February. So far, it has been nine consecutive months of decline in home prices and its steepest pace since August 2015.
Home properties form a significant store of wealth for China’s citizens, triggering an adverse wealth effect on consumer confidence and spending in the past two years.
A weaker Chinese yuan is likely the solution to offset weak domestic demand
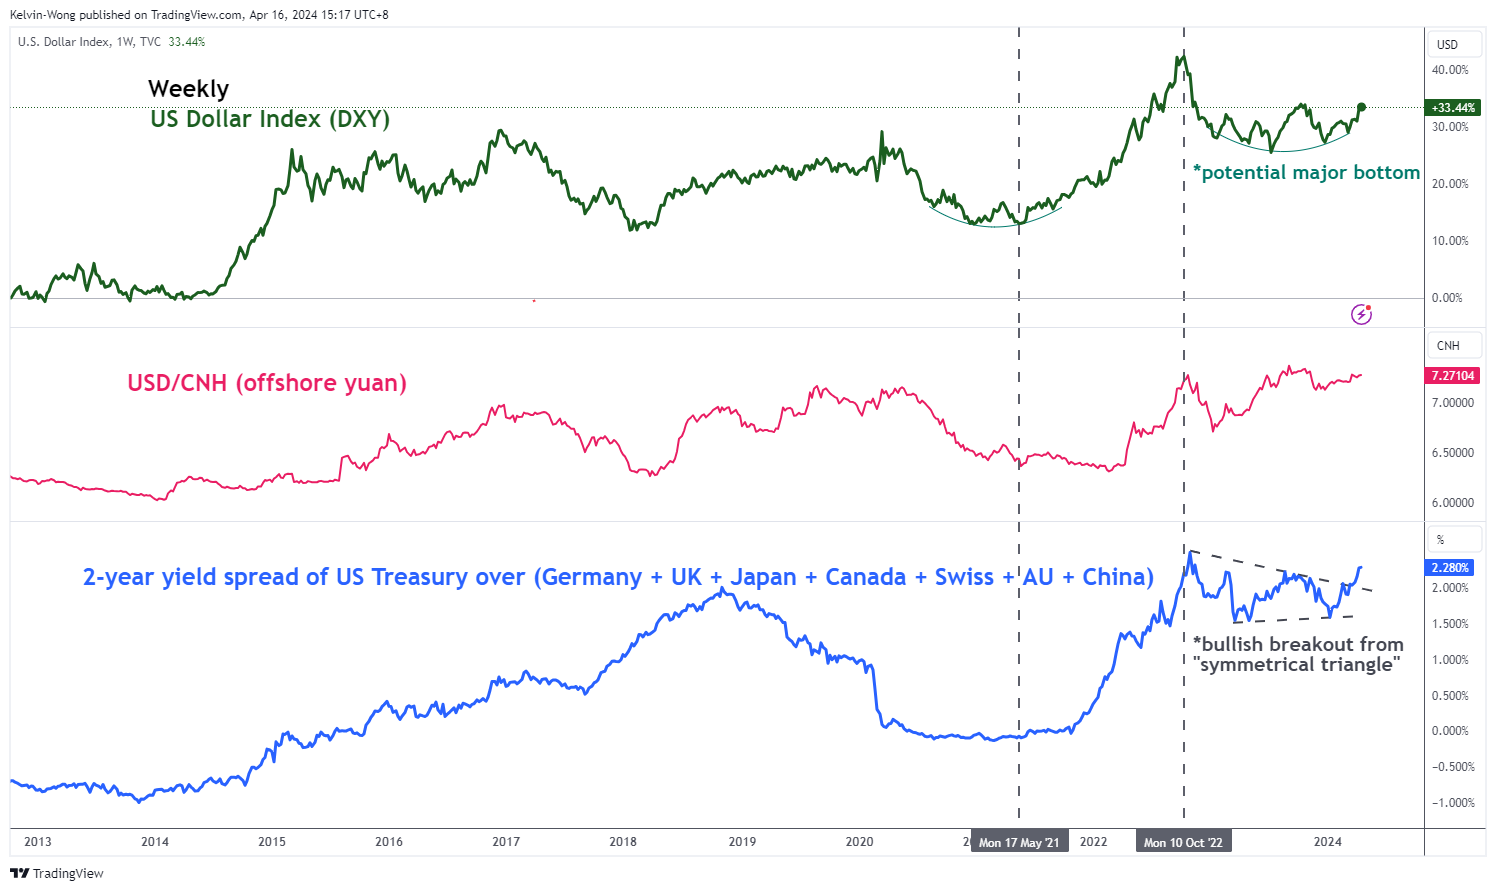
Fig 1: Major trends of US Dollar Index, USD/CNH & 2-YR US Treasury yield spread over rest of the world as of 16 Apr 2024 (Source: TradingView, click to enlarge chart)
China’s top policymakers have set a lofty GDP growth target of around 5% for this year and with the reluctance to deploy significant fiscal and monetary stimulus measures to jump-start internal demand; the other avenue to achieve such an economic growth trajectory is via the external sector from exports growth through a devaluation of the yuan.
A persistent bout of yuan weakness coupled with the US Federal Reserve’s current less dovish stance versus other major developed nations’ central banks is likely to create another layer of US dollar strength via an increase in yield premiums of US Treasuries over the rest of the world sovereign bonds (see Fig 1).
Asian stock indices are likely to continue to face downside pressure in a weak yuan environment
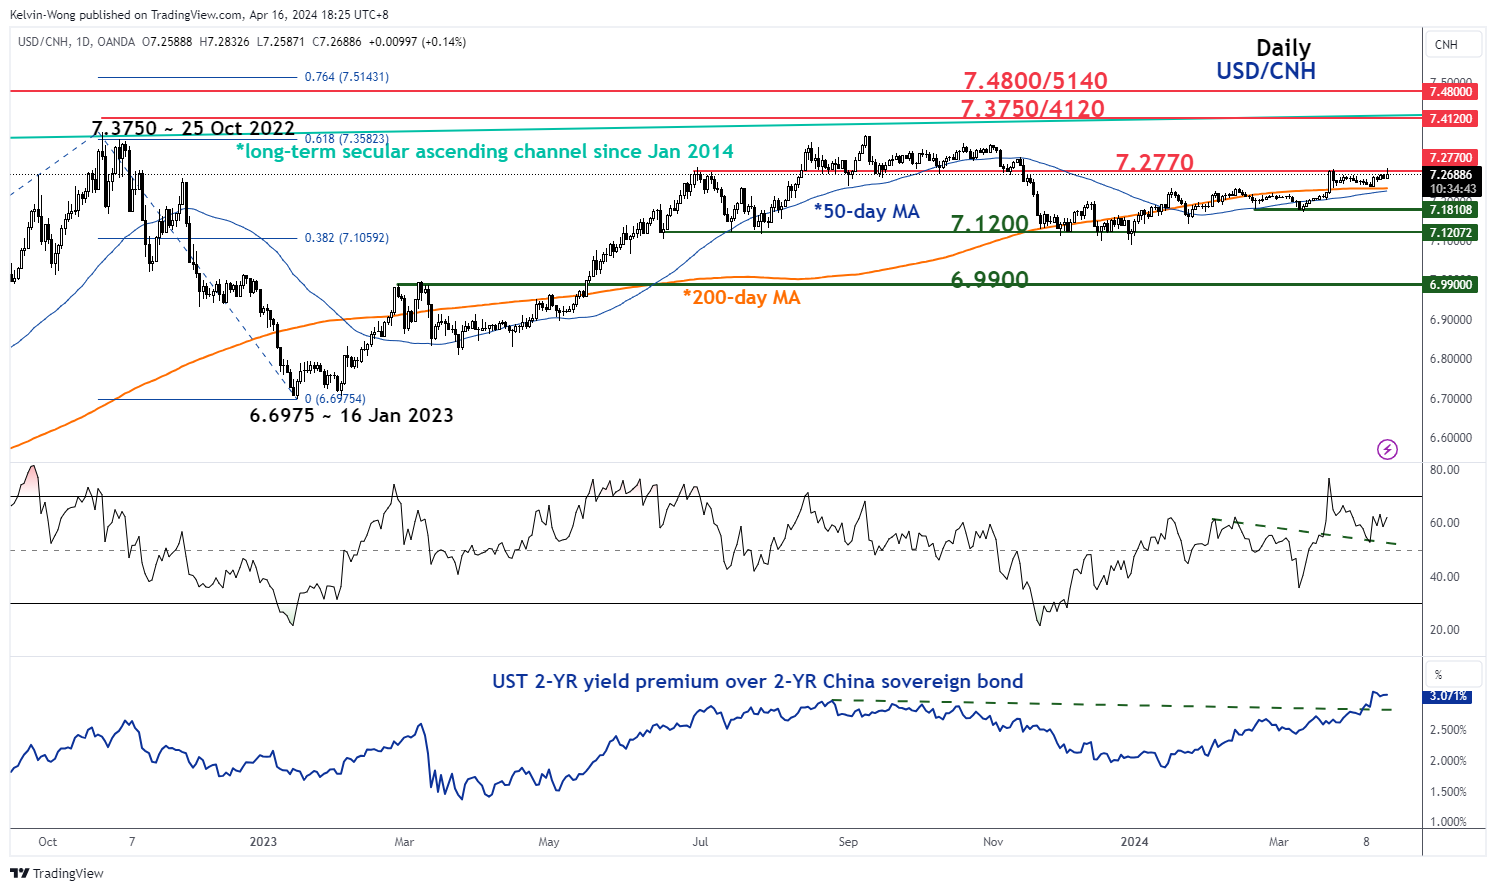
Fig 2: USD/CNH major & medium-term trends as of 16 Apr 2024 (Source: TradingView, click to enlarge chart)
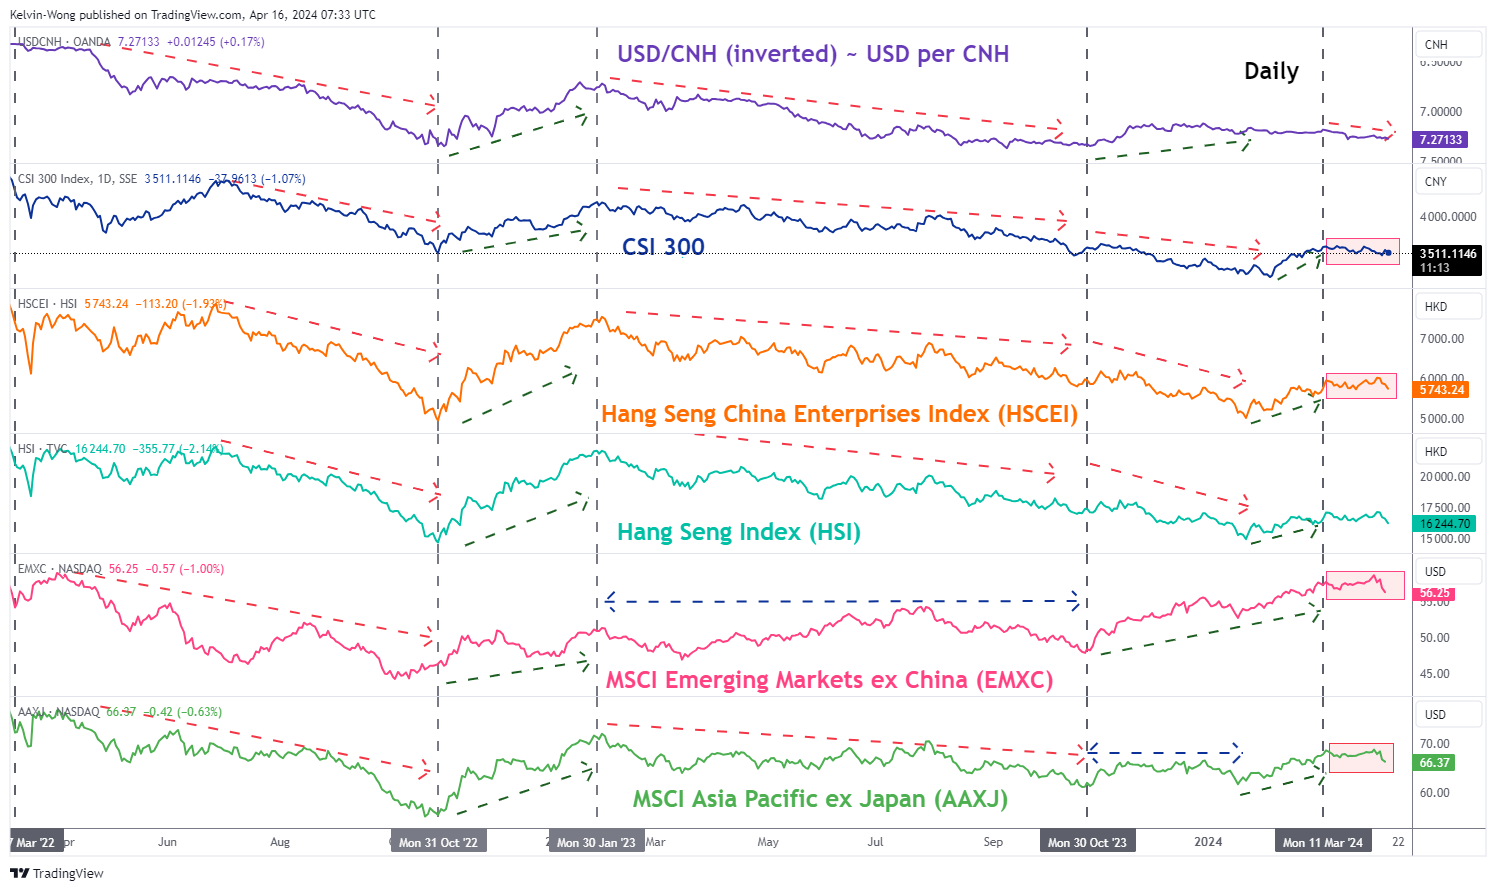
Fig 3: CNH/USD direct correlation with CSI 300, HSCEI, HSI, EMXC & AAXJ as of 15 Apr 2024 (Source: TradingView, click to enlarge chart)
In our previous article dated 25 March 2024, we wrote about the potential bearish implications on the Hang Seng stock indices and China’s CSI 300 triggered by a weakening offshore yuan (CNH) trend. Click here for a recap.
In the past week, the USD/CNH has traded firmly above its upward-slopping 50-day and 200-day moving averages, and in today’s Asian session, it probed again the key near-term resistance of 7.2770. A clear break above 7.2770 is likely to revive a potential bullish impulsive upmove sequence of the USD/CNH within its major uptrend phase (yuan weakness) (see Fig 2).
Hence, an adverse feedback loop is likely to take form as major exporting countries such as South Korea, Taiwan, Malaysia, and Singapore may face the pressure to engage in “beggar-thy-neighbour” currency war-liked monetary policies (deliberately weaken their respective domestic currencies) to maintain export competitiveness.
All in all, a persistent trend of Chinese yuan (CNH) weakness is likely to increase the odds of an impending medium-term bearish trend in Asian stock indices as indicated by the recent movements of the MSCI Asia Pacific ex Japan exchange-traded fund (AAXJ) since 11 March 2024 (see Fig 3).
The US stock market is unlikely to be immune from a persistent strong US dollar trend
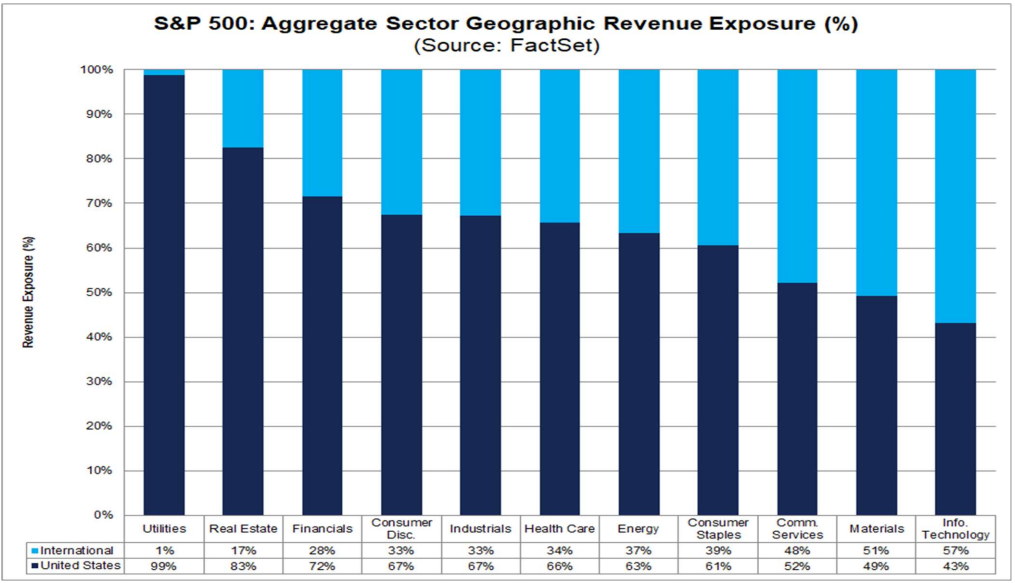
Fig 4: S&P 500 11 industry sectors’ geographical revenue weightage (Source: FactSet as of 12 Apr 2024, click to enlarge chart)
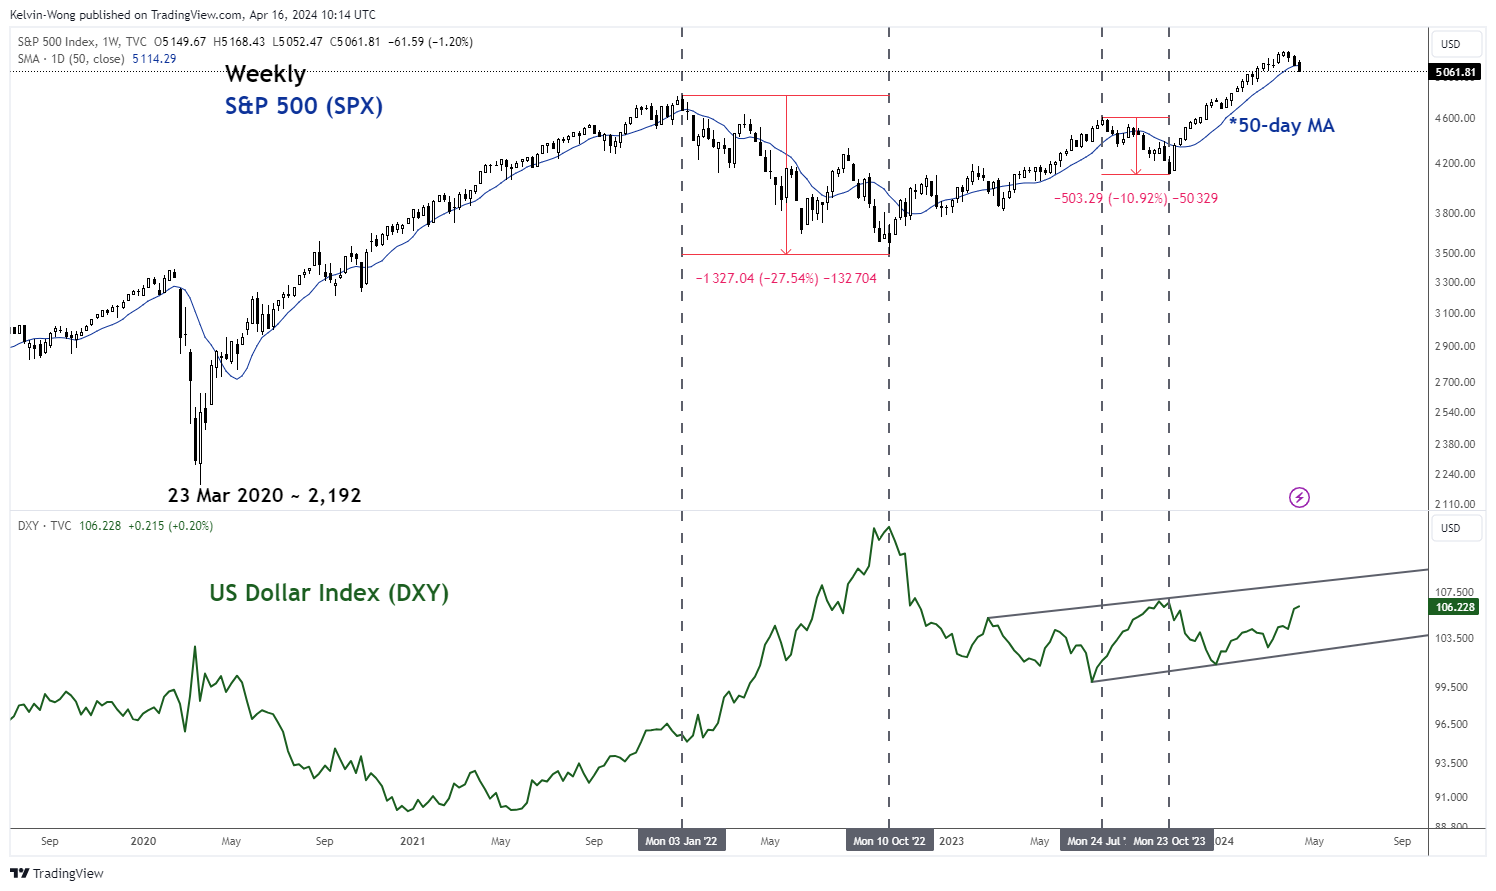
Fig 5: Major trend of S&P 500 with US Dollar Index as of 15 Apr 2024 (Source: TradingView, click to enlarge chart)
The S&P 500, a key benchmark stock index in the US as well as globally, is made up of the top 500 companies from eleven industry sectors, and the Information Technology sector has the highest skewed weightage of around 30% in terms of market capitalization.
Therefore, the price action movements of technology stocks within the S&P 500 will have a much more significant impact on the directional bias of the S&P 500 which can also trigger pronounced feedback loops into the wider US stock market.
Based on the latest data from FactSet as of 12 April, the Information Technology sector of the S&P 500 has the highest portion of aggregate revenue derived from international markets standing at 57% which suggests that any significant US dollar appreciation against the rest of the world currencies will likely to have a negative drag on the total revenue flows of US technology stocks when converted back to US dollars in terms of financial reporting (see Fig 4).
In addition, the previous recent episodes of persistent US dollar strength (represented by the movements of the US Dollar Index) seen from January 2022 to October 2022, and July 2023 to October 2023 have corresponded with significant corrections of -27% and -11% inflicted on the S&P 500 over the similar periods (see Fig 5).
We have written several articles on the S&P 500 that highlighted the risk of an impending medium-term corrective downmove sequence, the latest one was published on 8 April, click here for a recap.
So far, the S&P 500 has dropped by -4% from its current all-time high of 5,265 printed in late March, and yesterday, 15 April it recorded a close below its 50-day moving average for the first time since 2 November 2023.
Perhaps, a looming persistent US dollar strength may be the final death knell to kickstart the potential medium-term corrective decline in the US S&P 500 which may transform into a negative cascading waterfall effect on global stock markets.
Content is for general information purposes only. It is not investment advice or a solution to buy or sell securities. Opinions are the authors; not necessarily that of OANDA Business Information & Services, Inc. or any of its affiliates, subsidiaries, officers or directors. If you would like to reproduce or redistribute any of the content found on MarketPulse, an award winning forex, commodities and global indices analysis and news site service produced by OANDA Business Information & Services, Inc., please access the RSS feed or contact us at info@marketpulse.com. Visit https://www.marketpulse.com/ to find out more about the beat of the global markets. © 2023 OANDA Business Information & Services Inc.

Kelvin Wong
Passionate about connecting the dots in the financial markets and sharing perspectives around trading and investment, Kelvin Wong is an expert in using a unique combination of fundamental and technical analyses, specializing in Elliott Wave and fund flow positioning, to pinpoint key reversal levels in the financial markets.
In addition, over the last ten years, Kelvin has conducted numerous market outlook and trading-related seminars, as well as technical analysis training courses, for thousands of retail traders.
Latest posts by Kelvin Wong (see all)
- Gold Technical: The recent sell-off may have reached a potential bullish reversal level at US$2,353 - 26 July 2024
- SPX 500: Further weakness may trigger a medium-term global risk-off event - 25 July 2024
- Nasdaq 100: Potential bullish reversal looms ahead of Alphabet and Tesla earnings results - 23 July 2024