It’s been a mixed week for AUDUSD which started with the pair breaking through the neckline of the double bottom and looking much more bullish, before breaking back below it again on weak Chinese trade data and speculation that the Reserve Bank of Australia could cut interest rates at the next meeting.
The result of this has been some consolidation in the pair and the formation of a triangle which could offer clues on its next move.
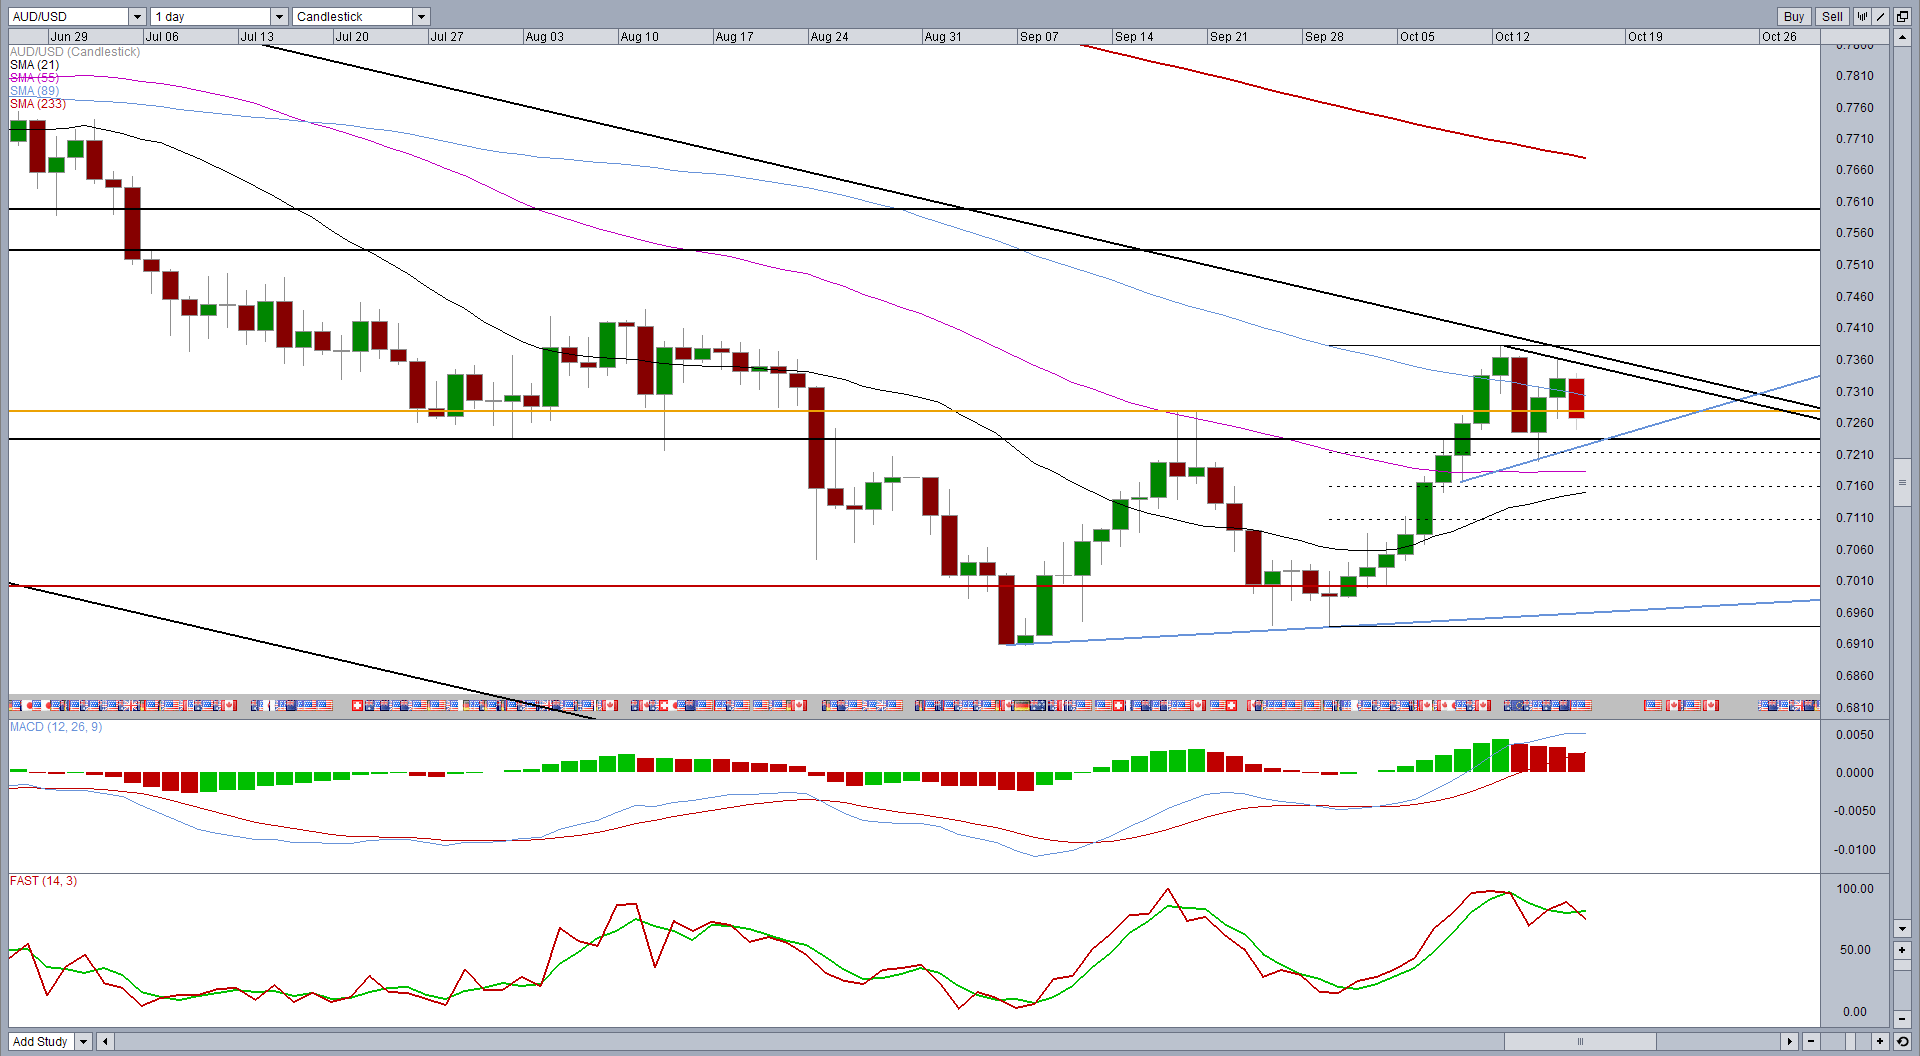
There is still an argument for gains to come in the pair, despite China slowing and speculation growing that the RBA could cut rates when it next meets on 3 November. For one, until now the RBA rate cut is purely speculation and China slowing is nothing new.
The chart also suggests traders are more indecisive at this stage rather than bearish. Price is consolidating rather than falling. Wednesday’s lows didn’t break below the daily closing levels in the middle of the double bottom so depending on how you measure those formations, it could be argued that it remains intact (although I prefer to use the high rather than the close so this is now invalid in my view).
While the triangle on the chart is only speculative because it’s only connected by two points on each trend line, a break above would suggest that traders are more bullish once again. A break below wouldn’t even mean the market is bearish again, it could just mean we’re seeing a larger retracement back to the 50% or 61.8% fib level and the formation of a flag or falling wedge.

In the meantime we could see some more consolidation in the pair and the next clue could come from how it reacts at the support trend line, assuming it reaches this level.
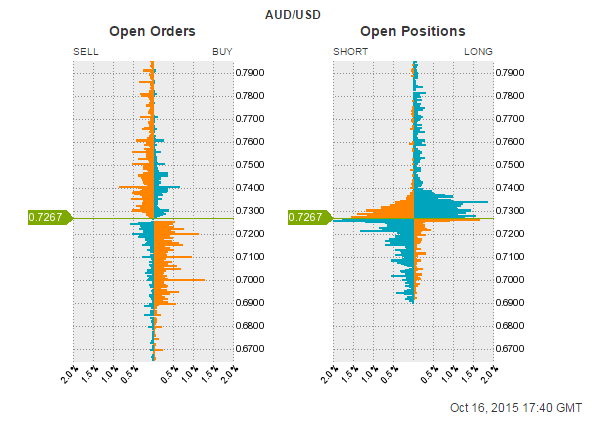
It’s interesting to see the the OANDA order book shows a number of open buy orders around 0.72 and 0.7220, the two key levels to the downside in this pair. There are also a growing number of open positions as the pair has edged lower which suggests there plenty of traders that view this as a dip rather than a more protracted move lower.
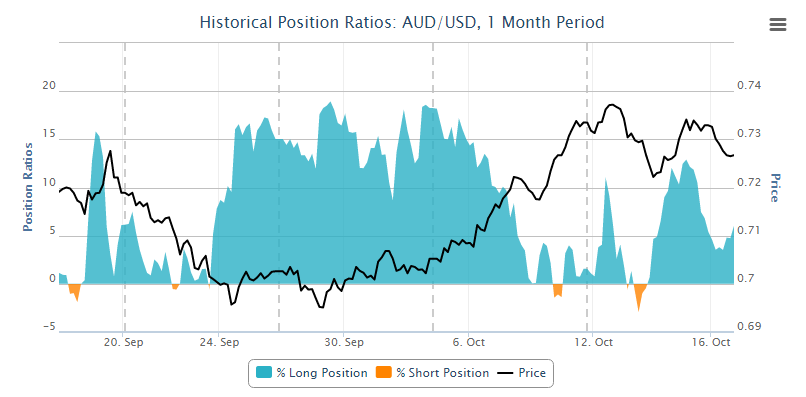
Over the last month, OANDA clients have been quite well positioned on this pair so this could be viewed as a bullish signal.
Content is for general information purposes only. It is not investment advice or a solution to buy or sell securities. Opinions are the authors; not necessarily that of OANDA Business Information & Services, Inc. or any of its affiliates, subsidiaries, officers or directors. If you would like to reproduce or redistribute any of the content found on MarketPulse, an award winning forex, commodities and global indices analysis and news site service produced by OANDA Business Information & Services, Inc., please access the RSS feed or contact us at info@marketpulse.com. Visit https://www.marketpulse.com/ to find out more about the beat of the global markets. © 2023 OANDA Business Information & Services Inc.

Former Craig
Latest posts by Former Craig (see all)
- Market Insights Podcast – US GDP, RBNZ holds, bitcoin soars - 28 February 2024
- Market Insights Podcast – Nvidia earnings, record highs for stocks - 23 February 2024
- EUR/USD – A bullish breakout or just further consolidation? - 22 February 2024