China kicks investors while they’re down
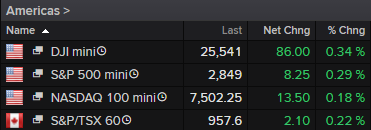
Jitters have well and truly set in and equity markets are suffering the consequences as investors head for safety in numbers.

Source – Thomson Reuters Eikon
Every time investors find the strength to pick themselves up off the floor, the trade war delivers another blow and knocks them down again. This morning that came in the form of reports that China is threatening retaliation against Trump’s tariffs that are due to come into force on 1 September.
Europe was trading in the green ahead of the report, paring losses after a rough session on Wednesday, but that didn’t last long and now we’re once again seeing some pretty heavy losses. US futures aren’t faring much better, which doesn’t bode well for Wall Street which suffered quite a backlash a day ago.
I guess this report also answers the question of whether China viewed the decision to delay half of the tariff hikes until mid-December as being conciliatory in any way or just an act of self-preservation, given the importance of the holiday season in the US. The market reaction also clearly highlights that investors are concerned about the economic impact of the trade war, regardless of Trump’s assertion that the Fed is the problem.
Sign up for our next webinar on 20 August below

Gold buoyed by risk-aversion but trend weakening
As ever, gold loves the risk-off environment and has found itself eyeing up this week’s highs once again. What’s interesting though is that the rally in gold over the last couple of days has actually been a little soft compared to what we’ve seen previously, possibly a sign of an overbought market as we head into a historically important region, around $1,520-1,560. Given the gains we’ve seen since late May, it would be understandable if traders began feeling less bullish on the yellow metal now.
Gold Daily Chart
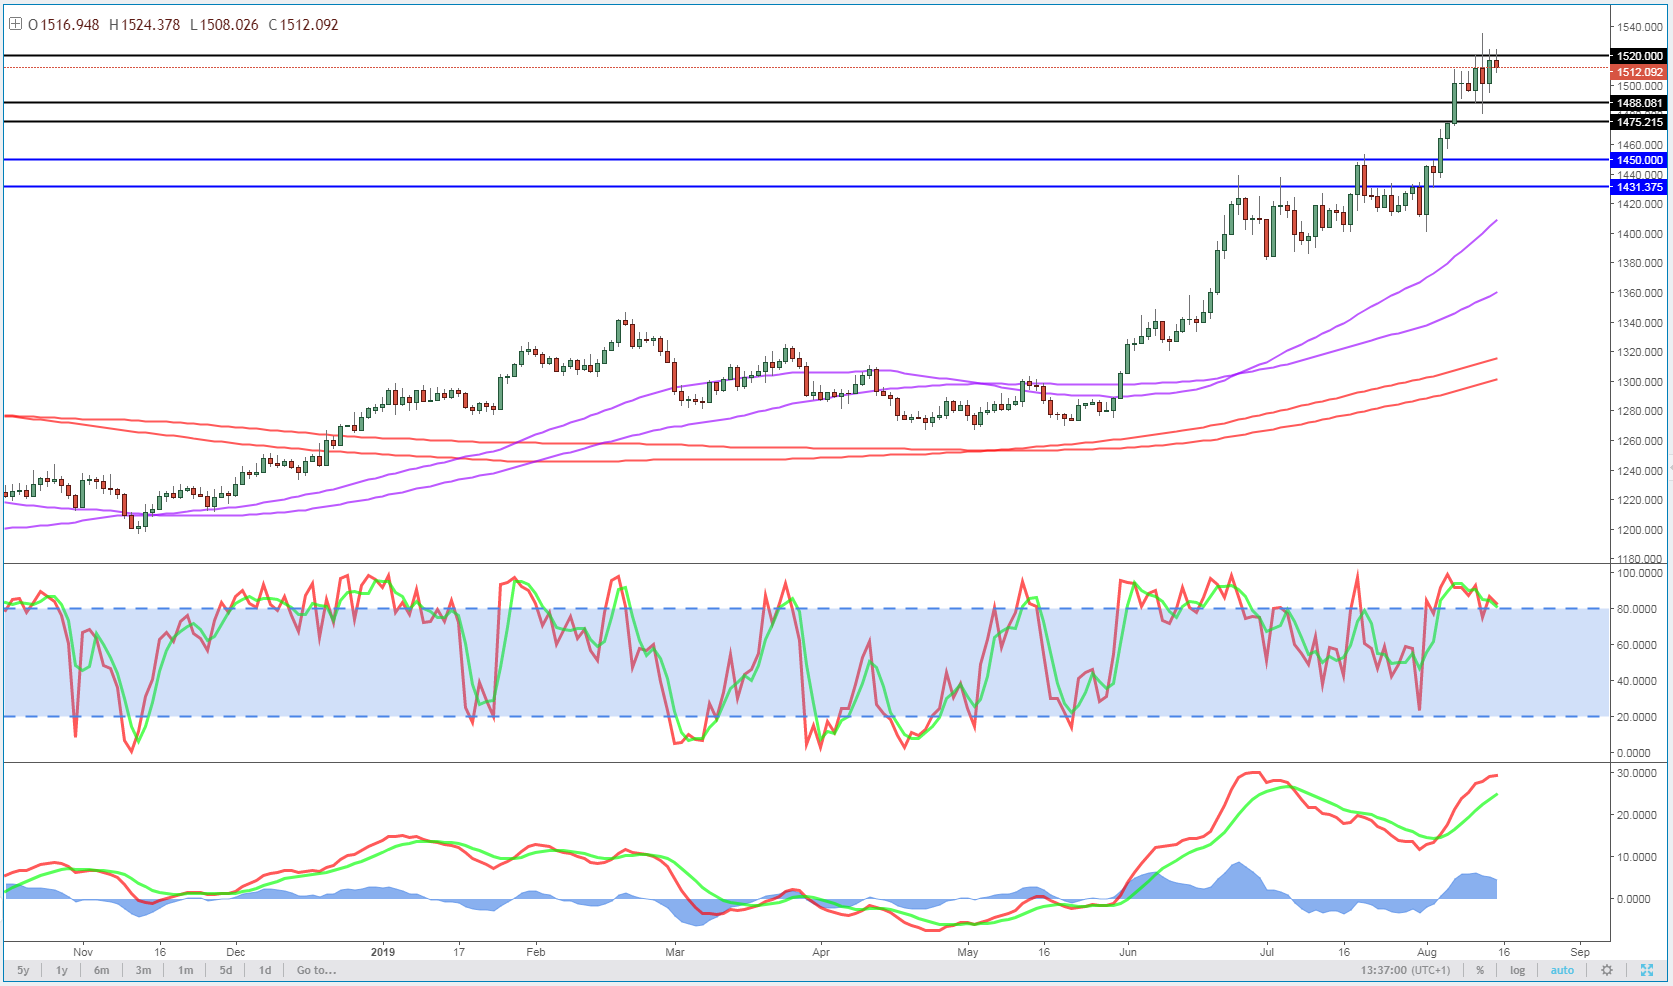
OANDA fxTrade Advanced Charting Platform
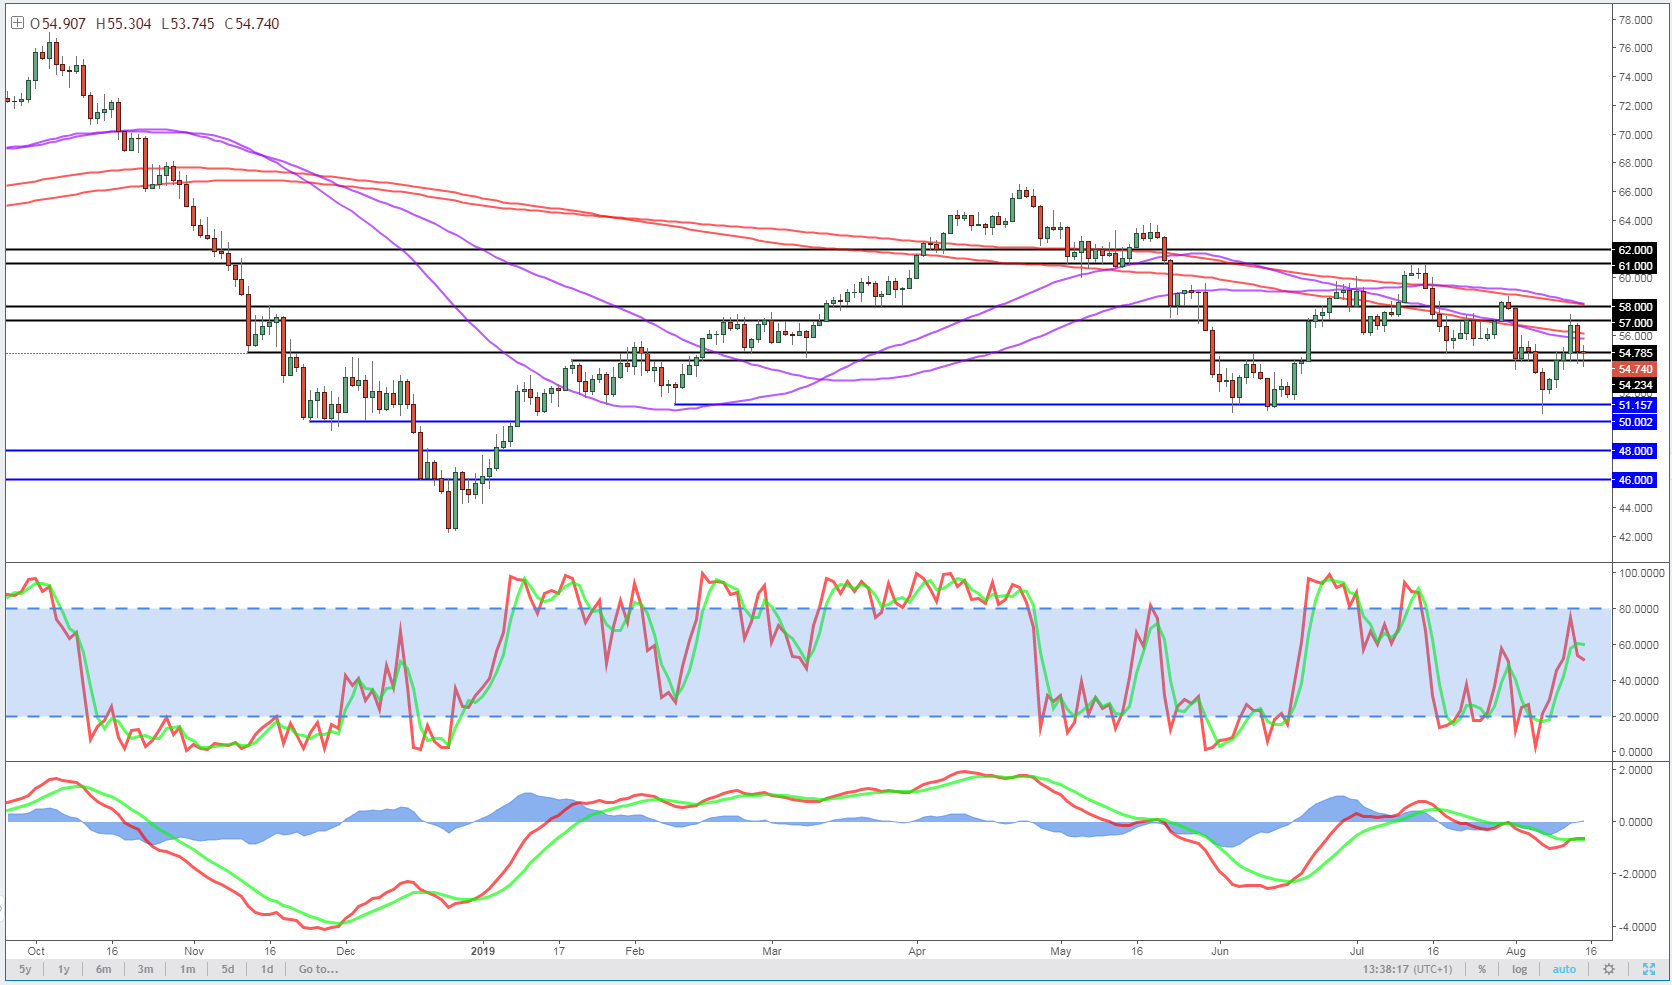
Oil pummeled by trade war escalation
Oil is getting whacked again as risk-aversion again kicks in and fears of a trade war inflicted slowdown grip traders. WTI had enjoyed a decent rebound over the last week but failed at the first hurdle, running into resistance around the mid-July lows before plunging once again. A break below $58 will draw attention to this month’s lows around $56, with a break of this being another worrying sign.
WTI Daily Chart
Economic Calendar
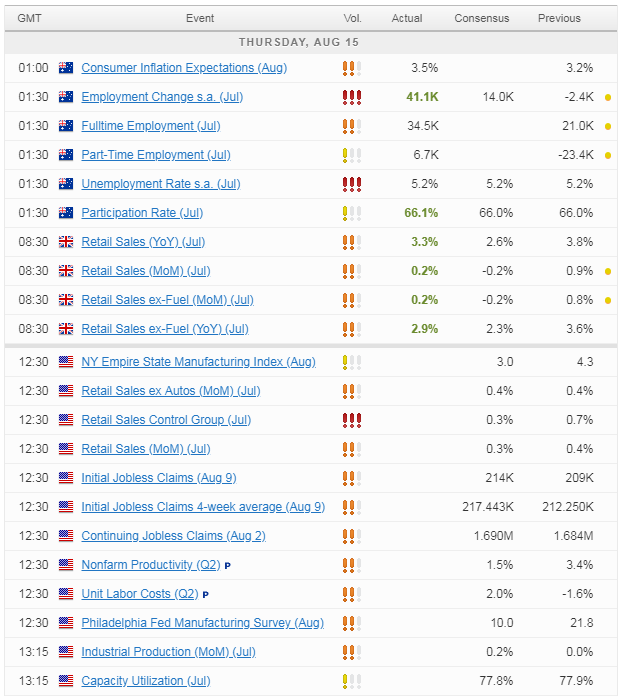
For a look at all of today’s economic events, check out our economic calendar.

Content is for general information purposes only. It is not investment advice or a solution to buy or sell securities. Opinions are the authors; not necessarily that of OANDA Business Information & Services, Inc. or any of its affiliates, subsidiaries, officers or directors. If you would like to reproduce or redistribute any of the content found on MarketPulse, an award winning forex, commodities and global indices analysis and news site service produced by OANDA Business Information & Services, Inc., please access the RSS feed or contact us at info@marketpulse.com. Visit https://www.marketpulse.com/ to find out more about the beat of the global markets. © 2023 OANDA Business Information & Services Inc.

Former Craig
Latest posts by Former Craig (see all)
- Market Insights Podcast – US GDP, RBNZ holds, bitcoin soars - 28 February 2024
- Market Insights Podcast – Nvidia earnings, record highs for stocks - 23 February 2024
- EUR/USD – A bullish breakout or just further consolidation? - 22 February 2024