Business confidence sinks
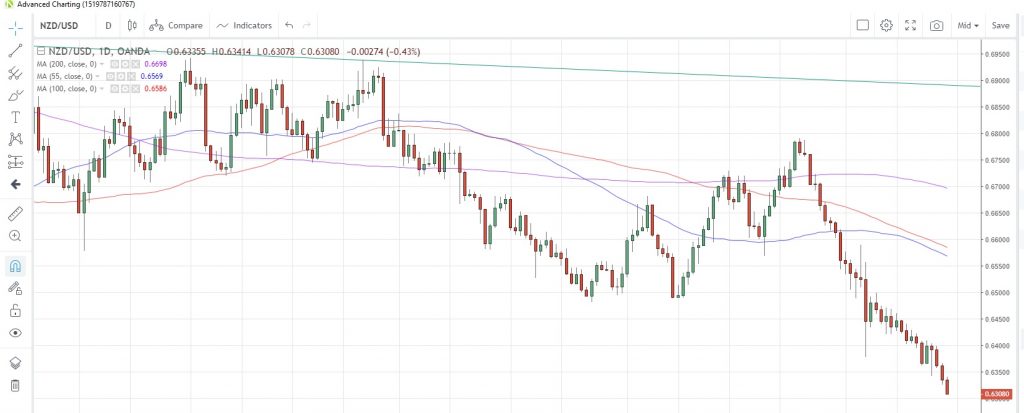
The Kiwi slumped across the board after ANZ’s business confidence indicator slumped to -52.3 in August, a sharp drop from July’s -44.3 print and the weakest level since April 2008. NZD/USD fell as much as 0.39% to hit 0.6310, the lowest level since September 2015 while NZD/JPY declined to its weakest since November 2012. NZD/USD is now at 0.6320 and is facing its fourth down-day in a row.
NZD/USD Daily Chart
Aussie also hit by weak data
The poor data flow was not just restricted to New Zealand, with Australia’s private capital expenditure falling 0.5% in the second quarter, disappointing analysts who had been expecting a rebound to +0.5% from -1.7% in Q1. AUD/USD slid 0.13% to 0.6724 and is now at 0.6731.
Trade talks still on
US Treasury Secretary Steven Mnuchin said that US officials are still expecting Chinese negotiators to visit Washington, but was non-committal whether the previously-planned September meeting would go ahead. Relations have soured in the past couple of weeks since the US team was last in China, with the US labeling China as a currency manipulator on August 5 and Trump adding an extra 5% to all tariffs, while China added a retaliatory 5-10% tariff on $75 billion worth of US imports last week.
Separately, White House trade adviser Navarro reiterated that it was unlikely that anything would happen quickly in the trade talks. On August 9 he said talks would play out over the next “several months”.
Euro-zone confidence seen weak
A slew of confidence indicators for August are due to be released today. Consumer and industrial confidence as seen steady at -7.1 and -7.4 respectively, but the economic sentiment indicator is expected to slide to 102.3 from 102.7. That would be the weakest reading since February 2015.
Anticipating a downward revision to US Q2 GDP
Market analysts are anticipating a downward tweak to US Q2 GDP growth, with the latest survey showing a drop to +2.0% from the first estimate of +2.1%. We can also expect wholesale inventories and the goods trade balance for July along with pending home sales. Sales are seen flat month-on-month after a 2.8% increase the previous month.
The full MarketPulse data calendar can be viewed at https://www.marketpulse.com/economic-events/
Content is for general information purposes only. It is not investment advice or a solution to buy or sell securities. Opinions are the authors; not necessarily that of OANDA Business Information & Services, Inc. or any of its affiliates, subsidiaries, officers or directors. If you would like to reproduce or redistribute any of the content found on MarketPulse, an award winning forex, commodities and global indices analysis and news site service produced by OANDA Business Information & Services, Inc., please access the RSS feed or contact us at info@marketpulse.com. Visit https://www.marketpulse.com/ to find out more about the beat of the global markets. © 2023 OANDA Business Information & Services Inc.


