- Last Friday’s price actions of spot Gold (XAU/USD) have managed to find support again at the 200-day moving average ahead of the US CPI data release & ECB monetary policy decision this week.
- The recent -5.15 % decline seen in Gold from its 20 July 2023 swing high of US$$1,987.53 has started to see some signs of short-term bullish reversal elements since 21 August 2023.
- The up-trending 10-year US Treasury real yield has also started to consolidate between 1.95% to 2.00% level which may negate the bearish tone on Gold at least in the short-term.
- US$1,910 support and US$1,932 resistance are the two key short-term technical levels to watch.
Since its 20 July 2023 swing high of US$1,987.53, spot Gold (XAU/USD) has declined by -5.15% to print a low of US$1,885 on 17 August 2023 in line with a rising longer-term 10-year US Treasury real yield which increased the opportunity costs of holding gold as it is a non-interest yielding asset.
Major uptrend remains intact
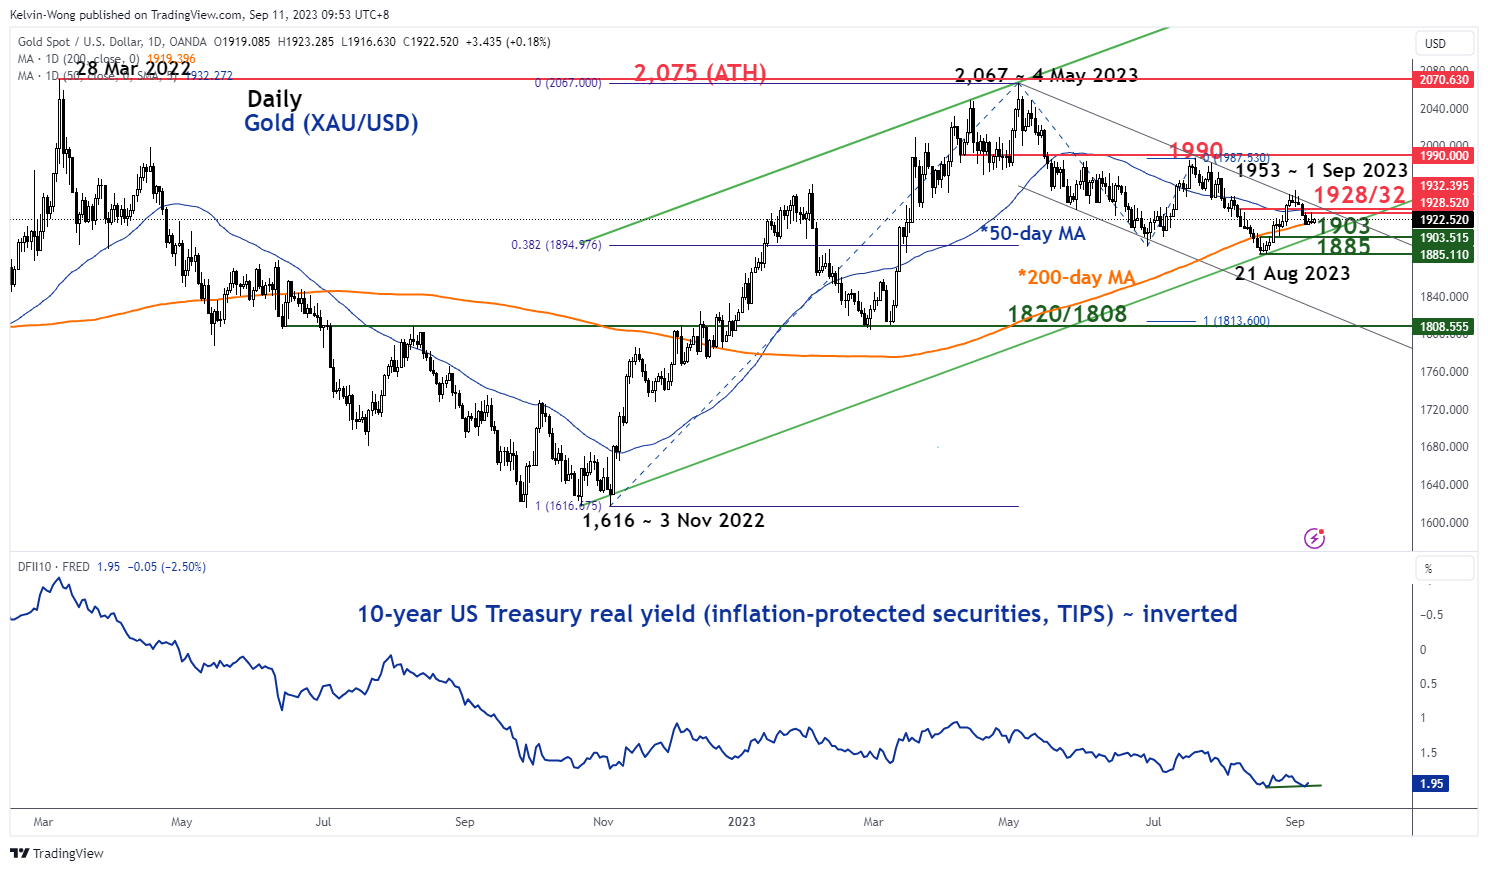
Fig 1: Gold (XAU/USD) major trend as of 11 Sep 2023 (Source: TradingView, click to enlarge chart)
Despite the underperformance of Gold seen in the past five weeks, its major uptrend phase in place since the 3 November 2022 low of US$1,616 remains intact as the -5.15% fall from the 20 July 2023 high of US$1,987.15 has managed to stall at the lower boundary of a major ascending channel from its 3 November 2022 major swing low and close to the 38.2% Fibonacci retracement of the prior major uptrend phase from 3 November 2022 low to 4 May 2023 high (see daily chair).
Also, the up-trending 10-year US Treasury real yield (derived via the inflation-protected securities, TIPS of the same duration) has started to consolidate at the 1.95% to 2.00% level which may negate the bearish tone on Gold at this juncture.
Short-term momentum has tilted toward the bullish camp
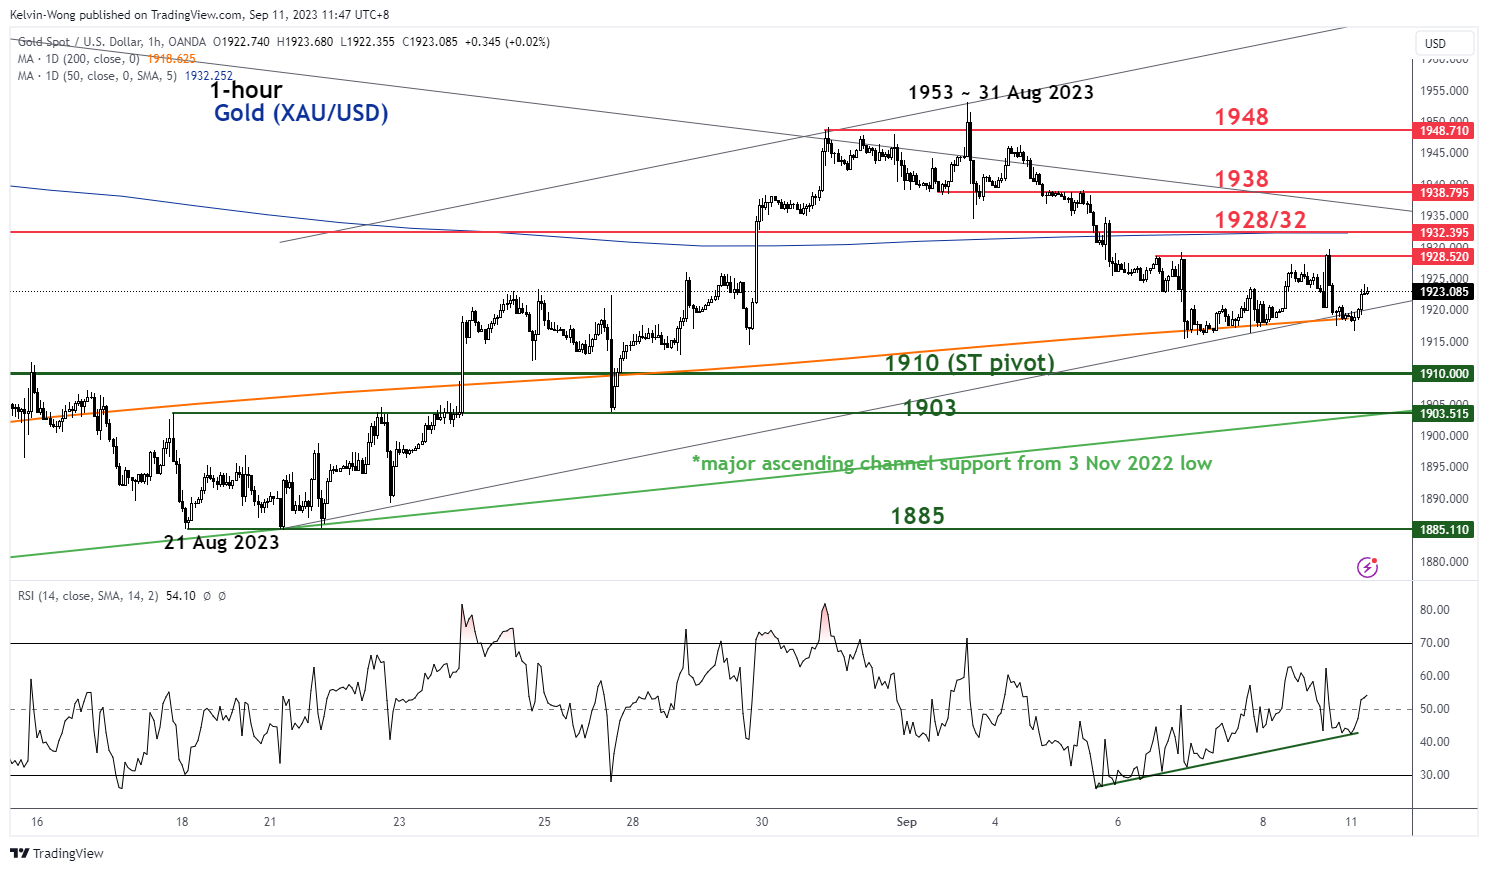
Fig 2: Gold (XAU/USD) minor short-term uptrend as of 11 Sep 2023 (Source: TradingView, click to enlarge chart)
Since 26 August 2023, the price actions of Gold (XAU/USD) have reintegrated back above the key 200-day moving average and its recent slide from its US$1,953 minor swing high of 1 September 2023 has managed to find support at the 200-day moving after a retest on it on last week, the lower boundary of a minor ascending channel from 21 August 2023 low and close to the 50% Fibonacci retracement of the recent minor uptrend from 21 August 2023 low to 1 September 2023 high.
In addition, the hourly RSI oscillator, a gauge of short-term momentum shaped a bullish divergence condition on 7 September 2023 and continued to trace out a series of “higher lows” thereafter.
These observations indicate a revival of short-term bullish momentum conditions that in turn advocates another round of minor potential up leg in Gold. Watch the US$1,910 key short-term pivotal support and a break above the intermediate resistance at US$1,932 (also the 50-day moving average) may see a further push-up for the next resistances to come in at US$1,938 and US$1,949.
On the other hand, failure to hold at US$1,910 invalidates the bullish scenario for a further slide to expose the major support at US$1,903.
Content is for general information purposes only. It is not investment advice or a solution to buy or sell securities. Opinions are the authors; not necessarily that of OANDA Business Information & Services, Inc. or any of its affiliates, subsidiaries, officers or directors. If you would like to reproduce or redistribute any of the content found on MarketPulse, an award winning forex, commodities and global indices analysis and news site service produced by OANDA Business Information & Services, Inc., please access the RSS feed or contact us at info@marketpulse.com. Visit https://www.marketpulse.com/ to find out more about the beat of the global markets. © 2023 OANDA Business Information & Services Inc.
Kelvin Wong
Latest posts by Kelvin Wong (see all)
- USD/JPY: An overextended intraday rally makes it vulnerable to a squeeze down with rumoured talks of FX intervention - 29 April 2024
- USD/JPY: Persistent JPY bearish trend intact despite growing intervention risk - 25 April 2024
- Gold Technical: Is the bull run over after its worst daily decline in 2 years? - 24 April 2024