- Gold (XAU/USD) has dropped by -5.6% from its recent 52-week high of US$2,067.
- Factors that caused the recent drop could be the bounce seen in the US dollar and the unwinding of long hedges linked to the US debt ceiling negotiations.
- 50-day moving average is now acting as a key intermediate resistance at US$1,991.
The bullish momentum of the shiny metal, Gold (XAU/USD) seems to have dissipated in recent weeks after it printed a fresh 52-week high of US$2,067 on 4 May 2023 and staged a decline of -5.6% to hit a low of US$1,952 on last Thursday, 18 May.
Even though on Friday, 19 May, the price actions of Gold managed to stage a rebound of +1% to close the US session at US$1,977.90 but it is still below its 20 and 50-day moving averages that are acting as resistances at around US$2,008 and USS$1,991 respectively at this time of the writing.
The recent price weakness of Gold is indirectly related to the recent rebound seen in the US dollar where the US Dollar Index has managed to stage a weekly rebound of +1.40% for the week of 8 May, its highest weekly gain since the week of 19 September 2022.
Also, there were news reports that stated there were potential breakthroughs in the US debt ceiling limit extension negotiation talks between the Biden Administration and the House Republicans that could trigger some form of hedges positions unwinding on Gold that was taken earlier as long hedges if the US government fails to extend its debt ceiling limit on 1 June.
Let’s now decipher the latest price movement of Gold from a technical analysis perspective.
Gold (XAU/USD) Technical Analysis – Short-term corrective decline within a major uptrend
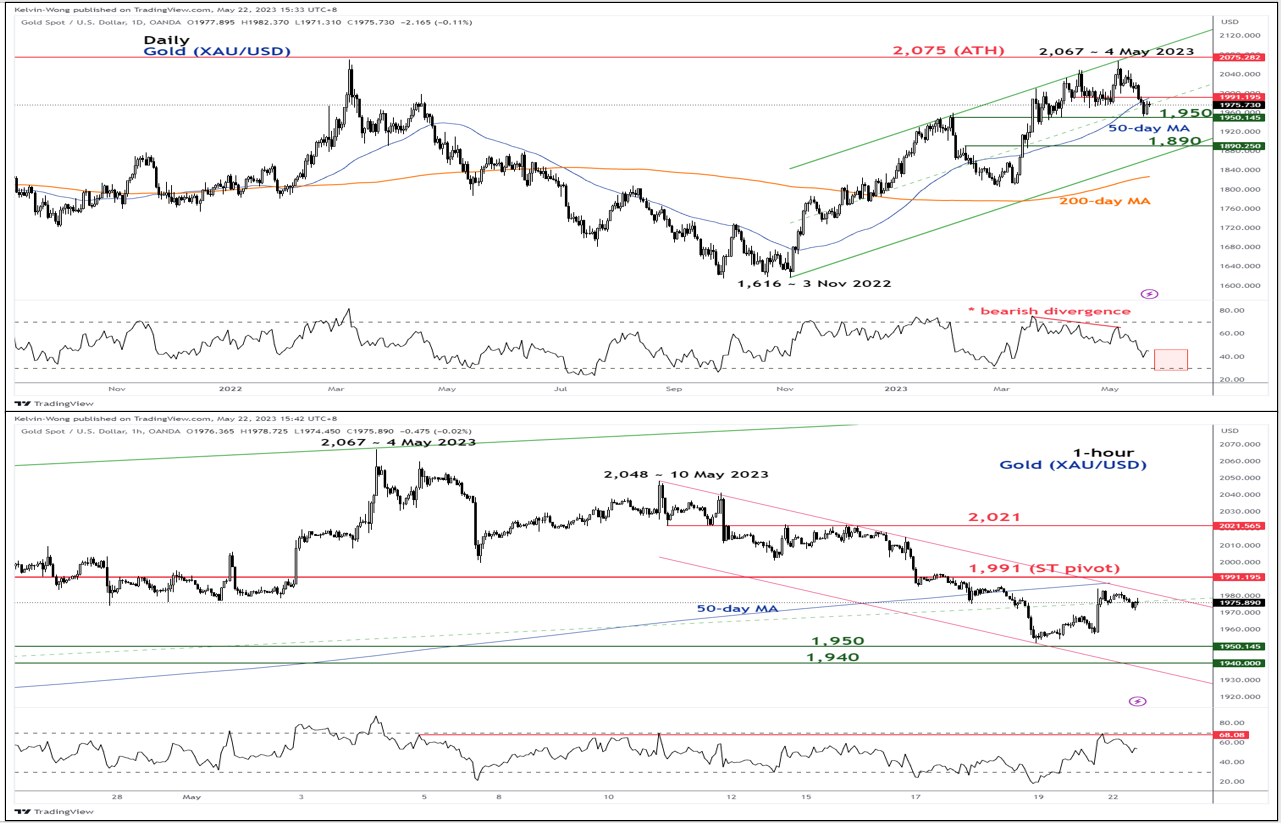
Fig 1: Gold (XAU/USD) trend as of 22 May 2023 (Source: TradingView, click to enlarge chart)
Since its 4 May 2023 swing high of US$2,067, Gold (XAU/USD), a whisker away from its current all-time high of US$2,075 printed on 7 August 2020, has reversed down from its major ascending channel upper limit/resistance and traded below the 50-day moving average since 18 May 2023.
These observations suggest that a short-term corrective decline is likely to be in play for Gold within a major uptrend phase that is still intact since the 3 November 2022 low of US$1,616.
As depicted on the 1-hour chart, the price actions of Gold have evolved into a minor descending channel since its 10 May 2023 minor swing high of US$2,048 with its channel resistance coincides with the 50-day moving average resistance at around US$1,991.
In addition, the 1-hour RSI has retreated from a corresponding resistance at the 68% level (close to the overbought region of 70% & above) which indicates that short-term downside momentum remains intact.
The near-term supports rest at US$1,950, the former swing high area of 01/02 February 2023, and US$1,940, defined by the lower limit of the minor descending channel and a cluster of Fibonacci extension levels.
On the flip side, a clearance with an hourly close above US$1,991 short-term pivotal resistance negates the bearish tone for the next intermediate resistance that is coming in at US$2,021 (minor congestion zone of 12/15 May 2023 & the 61.8% Fibonacci retracement of the recent slide from 4 May 2023 high to 18 May 2023 low).
Content is for general information purposes only. It is not investment advice or a solution to buy or sell securities. Opinions are the authors; not necessarily that of OANDA Business Information & Services, Inc. or any of its affiliates, subsidiaries, officers or directors. If you would like to reproduce or redistribute any of the content found on MarketPulse, an award winning forex, commodities and global indices analysis and news site service produced by OANDA Business Information & Services, Inc., please access the RSS feed or contact us at info@marketpulse.com. Visit https://www.marketpulse.com/ to find out more about the beat of the global markets. © 2023 OANDA Business Information & Services Inc.
Kelvin Wong
Latest posts by Kelvin Wong (see all)
- USD/JPY: An overextended intraday rally makes it vulnerable to a squeeze down with rumoured talks of FX intervention - 29 April 2024
- USD/JPY: Persistent JPY bearish trend intact despite growing intervention risk - 25 April 2024
- Gold Technical: Is the bull run over after its worst daily decline in 2 years? - 24 April 2024