- US Treasury needs to issue an approximate total amount of US$1.1 trillion in T-bills in H2 2023 to replenish its operating cash balance.
- Absorption of the US$1.1 trillion of T-bills issuance may trigger a significant liquidity squeeze.
- Liquidity conditions in the US have started to tighten reinforced by an increase in implied volatility of US Treasury bonds and a less dovish Fed.
- Persistent K-shaped performance led by mega-cap technology stocks in US stock indices increase the risk of a downside correction.
A puff of relief for global financial markets as the US White House administration and the Republican party-controlled House has managed to strike a tentative debt ceiling extension and suspension deal that lasts for two years before the newly announced “X-Date” of 5 June by US Treasury Secretary Janet Yellen before the US government runs of cash to pay for its obligations.
Right now, it’s all about convincing the “hard-core” factions of both camps; the conservative Republicans and progressive Democrats to vote for the deal which still has an element of uncertainty. In the shorter term from the perspective of “animal spirits” in the financial markets, risk-on behaviour persists as both the US S&P 500 and Nasdaq 100 futures have added to last Friday’s gains with intraday daily returns of +0.20% and 0.40% respectively in today’s Asian session at this time of the writing.
On the contrary from a medium-term horizon, the US stock market seems to be ignoring or complacent on a potential significant liquidity drain in the financial markets ex-post US debt ceiling extension deal agreement by Congress.
After Congress passed the deal, the next step for the US Treasury will be a furore of US Treasury bills (T-bills) issuance to faster shore up its dwindling cash reserves to meet its debt and payment obligations. The US Treasury’s operating cash balance stood at US$38.84 billion as of 25 May, its lowest level since September 2017.
Hence, the US Treasury needs to replenish its coffers by a total issuance of around US$1.1 trillion worth of T-bills in the second half of 2023 which can be absorbed by banks’ reserves via deposits and overnight funded trades with the Federal Reserve as well as money market mutual funds. If more absorptions are done via money market mutual funds, the strain on liquidity is likely to be muted.
In the past two weeks, liquidity and financial conditions have started to tighten as seen from several key leading indicators.
Positive momentum has started to built-up in the 10-year US Treasury yield
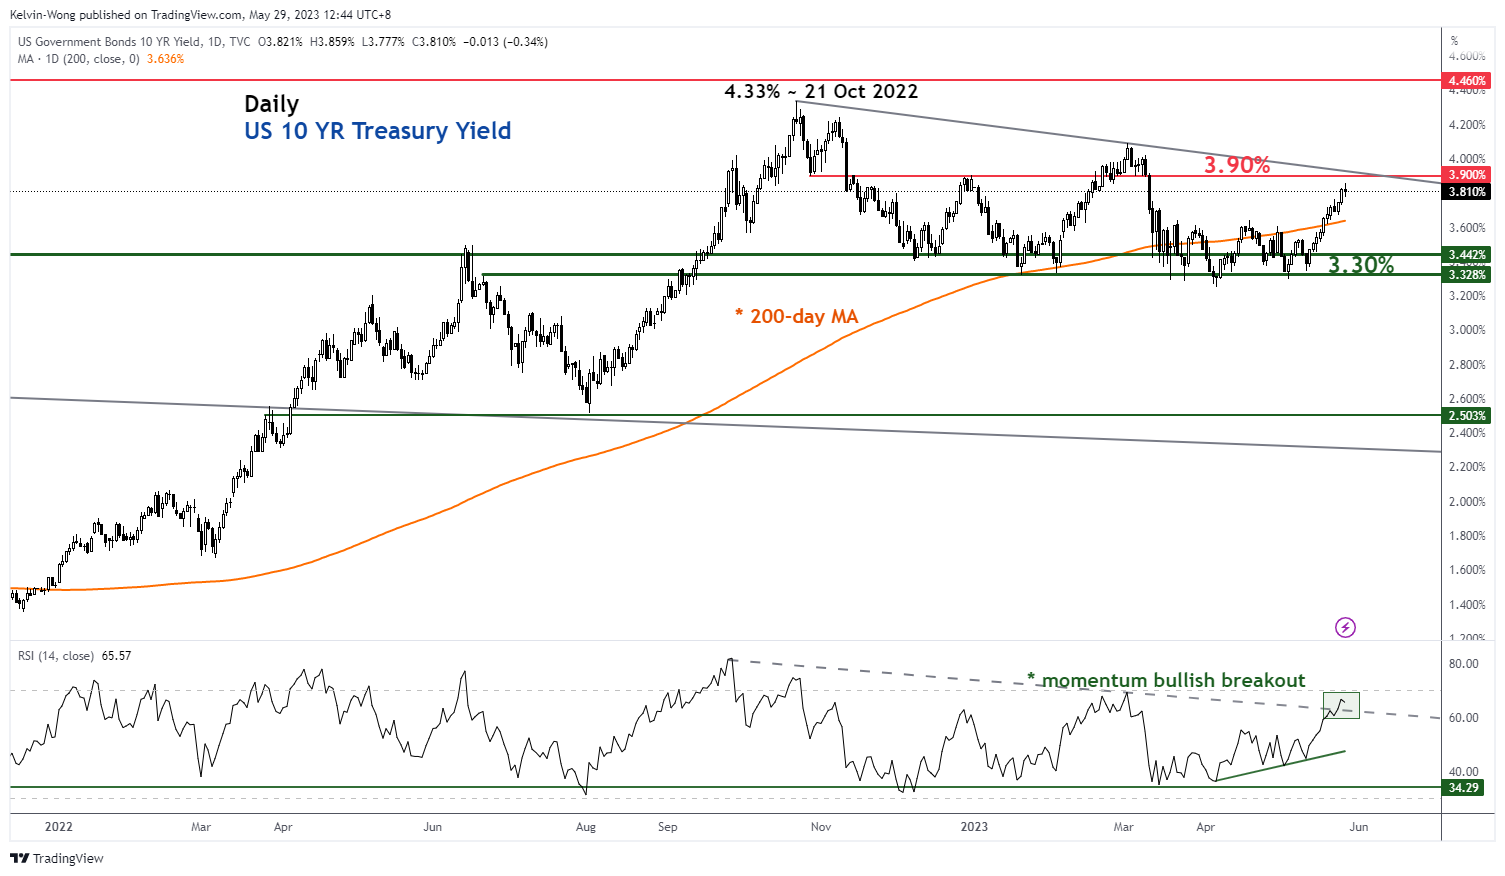
Fig 1: 10-year US Treasury yield trend as of 26 May 2023 (Source: TradingView, click to enlarge chart)
Firstly, the benchmark rate for corporate loans and bonds issuance, the 10-year US Treasury yield has risen by 34 basis points since the week of 15 May and surpassed the key upward-sloping 200-day moving average to last trade on last Friday, 26 May at 3.81%, a level that preceded the onset of the recent US regional banking turmoil in mid-March. From a technical analysis perspective, the daily RSI has recorded a momentum bullish breakout, increasing the odds for a further potential upside above 3.90% for the 10-year US Treasury yield.
US financial stress conditions have started to tick higher
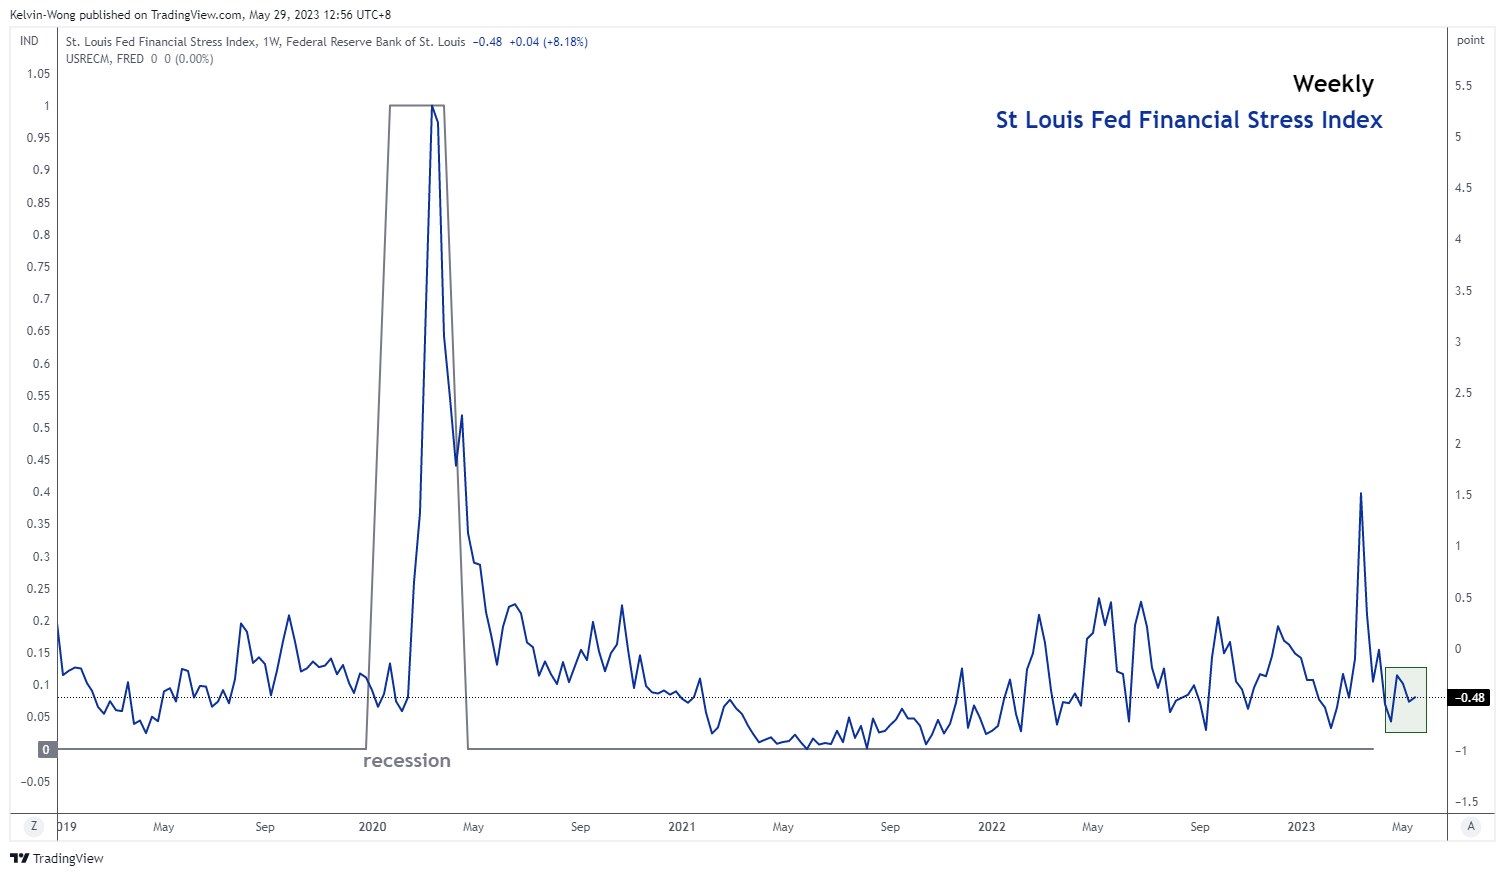
Fig 2: St Louis Fed Financial Stress Index as of 15 May 2023 (Source: TradingView, click to enlarge chart)
Secondly, the St Louis Federal Reserve Financial Stress Index has also started to tick up to its latest reading of -0.48 for the week of 15 May from its prior week of -0.52 and former a “higher low” which could indicate an early sign of liquidity tightening conditions.
Implied volatility in US Treasury bonds has remained at an elevated level
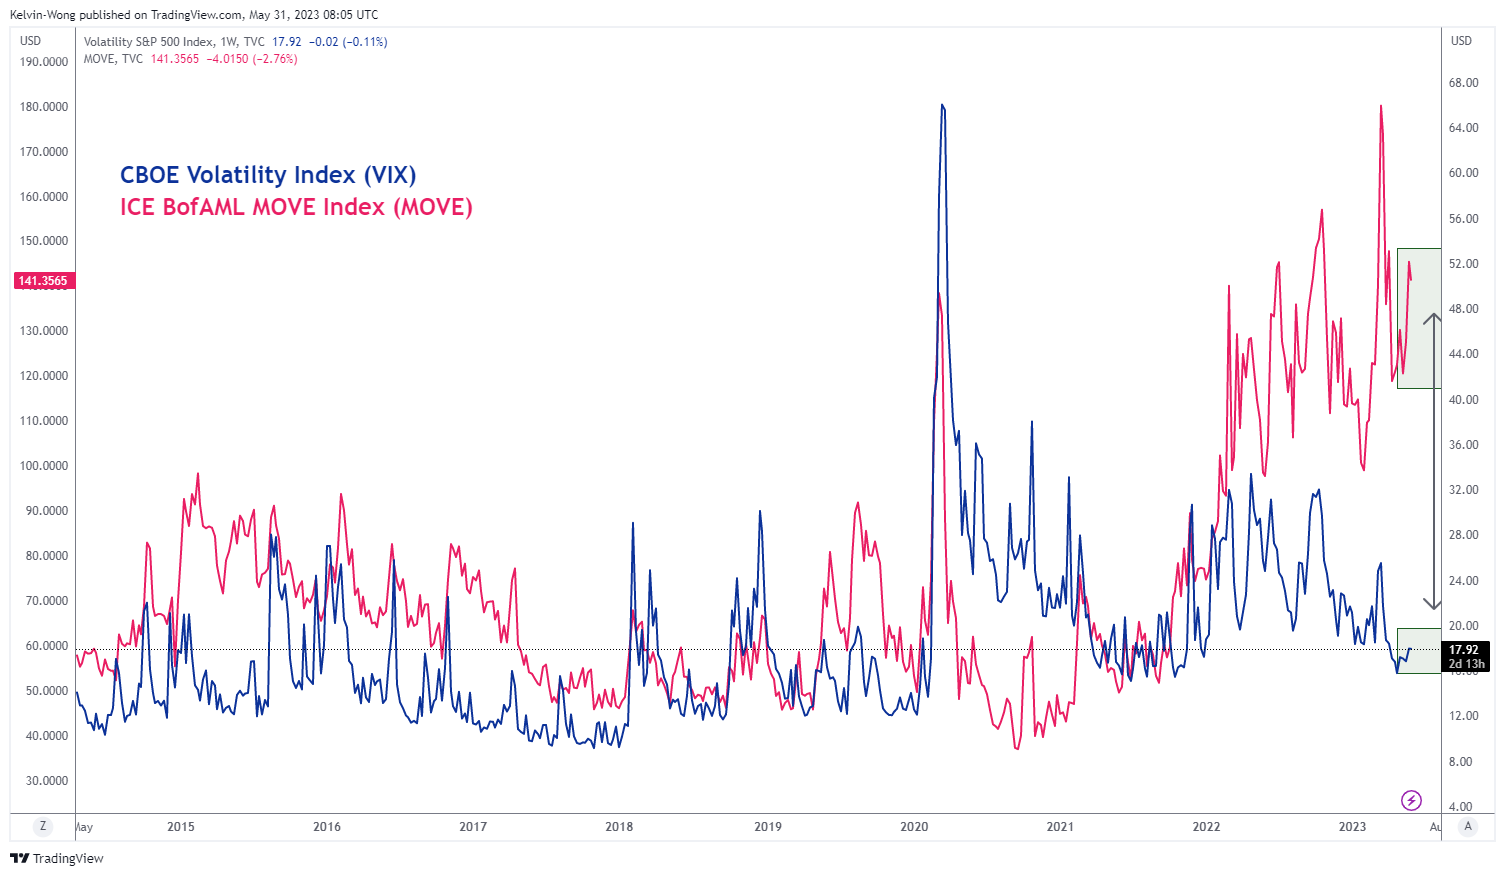
Fig 3: ICE BofAML MOVE Index & VIX as of 26 May 2023 (Source: TradingView, click to enlarge chart)
Thirdly, the implied volatility in the US Treasury bonds market inferred by the ICE BofAML MOVE Index has remained at an elevated level where it ticked higher last Friday, 26 May to 145.37, a level that was last seen during the onset of the US regional bank turmoil in March. These latest observations seen in the MOVE Index suggest that prices of US bonds may see further downside pressure and in turn, trigger a further rise in fixed income/bonds yields that create a potentially heightened liquidity squeeze environment.
Fed’s pause for upcoming June FOMC has evaporated
The fourth factor, the expectations of a Fed’s Pivot to kickstart its interest rate cut cycle before 2023 ends has started to lose momentum. Based on the latest data from the CME FedWatch tool (inferred from the pricing of Fed funds rate futures), the initial high probability of a pause on the Fed funds rate at 5.00% to 5.25% for the 14 June 2023 FOMC meeting seen four weeks ago has dissipated after the latest series of “Fed speak”. Right now, the Fed funds rate futures are pricing a 65.3% chance of a 25-basis point hike on 14 June.
“K-shaped” performance in the US stock market continues to persist
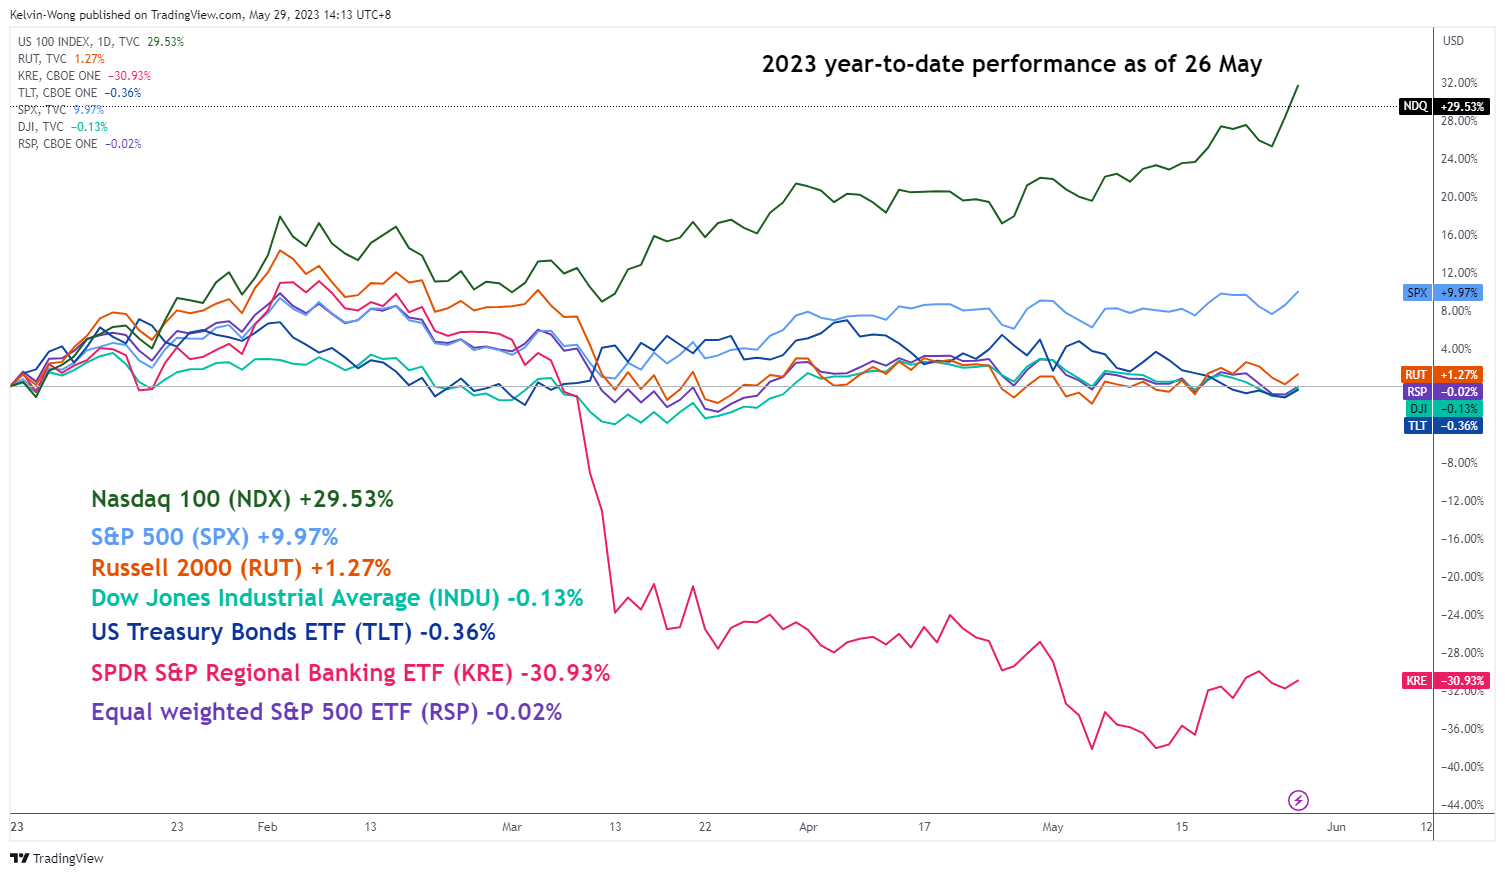
Fig 4: 2023 year-to-date performances of US stock indices as of 26 May 2023 (Source: TradingView, click to enlarge chart)
The loop-sided “K-shaped” performance has continued to persist in the US stock market since its October 2022 swing low. The benchmark stock indices; Nasdaq 100 and S&P 500 are heavily weighted by the mega capitalization technology stocks primarily the FAANG plus MNT group (Meta/Facebook, Apple, Amazon, Netflix, Alphabet/Google, Microsoft, NVIDIA & Tesla) have continued to outperform the rest (Dow Jones Industrial Average & Russell 2000) by a wide margin.
Thanks to the current AI-driven optimism theme play, the share price of NVIDIA staged a spectacular single-day rally of +24% last Thursday’s ex-post earnings announcement that skyrocketed Nasdaq 100’s 2023 year-to-date return to around +30%.
On the contrary, if we stripped out or normalized the weights of these mega capitalization technology stocks, the US stock market performance is just like a “speck of dust” where the equal-weighted S&P 500 ETF has turned negative (-0.02%) for the year.
Therefore, if such a “K-shaped” performance persists on the Nasdaq 100 and S&P 500, the odds are likely going to get higher for a downside correction to narrow the gap as a liquidity-tightening negative feedback loop can spiral easily into an increasingly weak US stock market breadth, a similar occurrence that was seen in March last year.
Content is for general information purposes only. It is not investment advice or a solution to buy or sell securities. Opinions are the authors; not necessarily that of OANDA Business Information & Services, Inc. or any of its affiliates, subsidiaries, officers or directors. If you would like to reproduce or redistribute any of the content found on MarketPulse, an award winning forex, commodities and global indices analysis and news site service produced by OANDA Business Information & Services, Inc., please access the RSS feed or contact us at info@marketpulse.com. Visit https://www.marketpulse.com/ to find out more about the beat of the global markets. © 2023 OANDA Business Information & Services Inc.
Kelvin Wong
Latest posts by Kelvin Wong (see all)
- USD/JPY: Persistent JPY bearish trend intact despite growing intervention risk - 25 April 2024
- Gold Technical: Is the bull run over after its worst daily decline in 2 years? - 24 April 2024
- Market Insights Podcast – BOJ, AU inflation, US PCE and US Magnificent 7 stocks earnings in the focus - 22 April 2024