- Recent rapid gains seen in the Nikkei 225 are likely to be attributed to the highly anticipated positive outcome of Japan’s annual wage negotiations results.
- The expected increase in wage growth for FY 2024/2025 may have already been fully priced in by the Japanese stock market.
- Recent bearish elements sighted in the US S&P 500 may led to a negative feedback loop into the Nikkei 225.
- Watch the key short-term resistance at 39,640 on the Nikkei 225.
This is a follow-up analysis of our prior reports, “Nikkei 225 Technical: Eyeing a potential new all-time high” and “SPX 500 Technical: The bulls are getting tired” published on 16 February and 7 March respectively. Click here and here for a recap.
The price actions of Nikkei 225 have continued to soar upwards to print fresh all-time highs and hit the lower limit of the 40,500/41,000 medium-term resistance zone (printed an intraday high of 40,472 last Thursday, 7 March).
It seems that last week’s bullish momentum has been driven by the highly anticipated positive results of the closely watched Japanese wage negotiations between labour unions and employers for FY 2024/2025.
Positive outcome of Japan’s annual wage negotiations may have been fully priced in
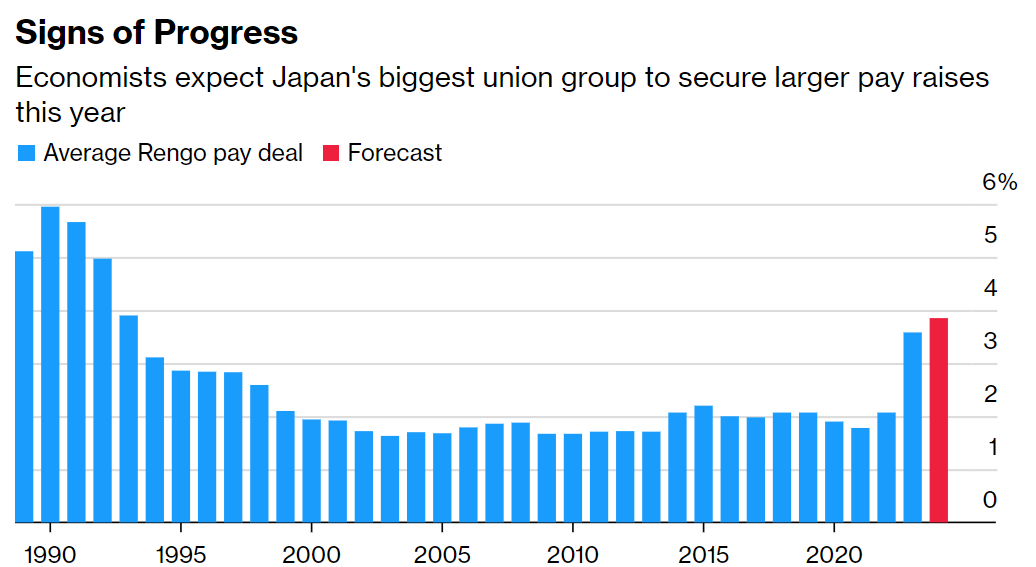
Fig 1: Japanese Trade Union Confederation average annualized pay deal (Source: Bloomberg News as of 10 March 2014, click to enlarge chart)
This coming Friday, 15 March, Japan’s main union group, Rengo will release the preliminary results of its negotiated wage increase for Japanese employees where the consensus is pegged at an expected average annualized increase of 3.85% for FY 2024/2025, above last year’s average increase of 3.58%, and if it turns out as expected, it will be the biggest jump in wage growth in Japan since 1993.
Such a rosy outcome is likely to increase consumer demand and allow the Bank of Japan (BoJ) to push forward to end its short-term negative interest rates policy in place since 2016 either in March or April this year, a signal that BoJ is confident that a decade-plus of deflationary spiral has ended in Japan. Going forward, these fundamental factors and spillovers are likely to a have positive net impact on the Japanese stock market and support a potential long-term bullish trend for the Nikkei 225.
In the short term, highly liquid financial markets tend to be forward-looking, and the potential positive outcome from the annual wage rise negotiations in Japan may have already been discounted as seen by the recent past week of positive movements in the Nikkei 225.
US S&P 500 has a significant direct influence on the Nikkei 225
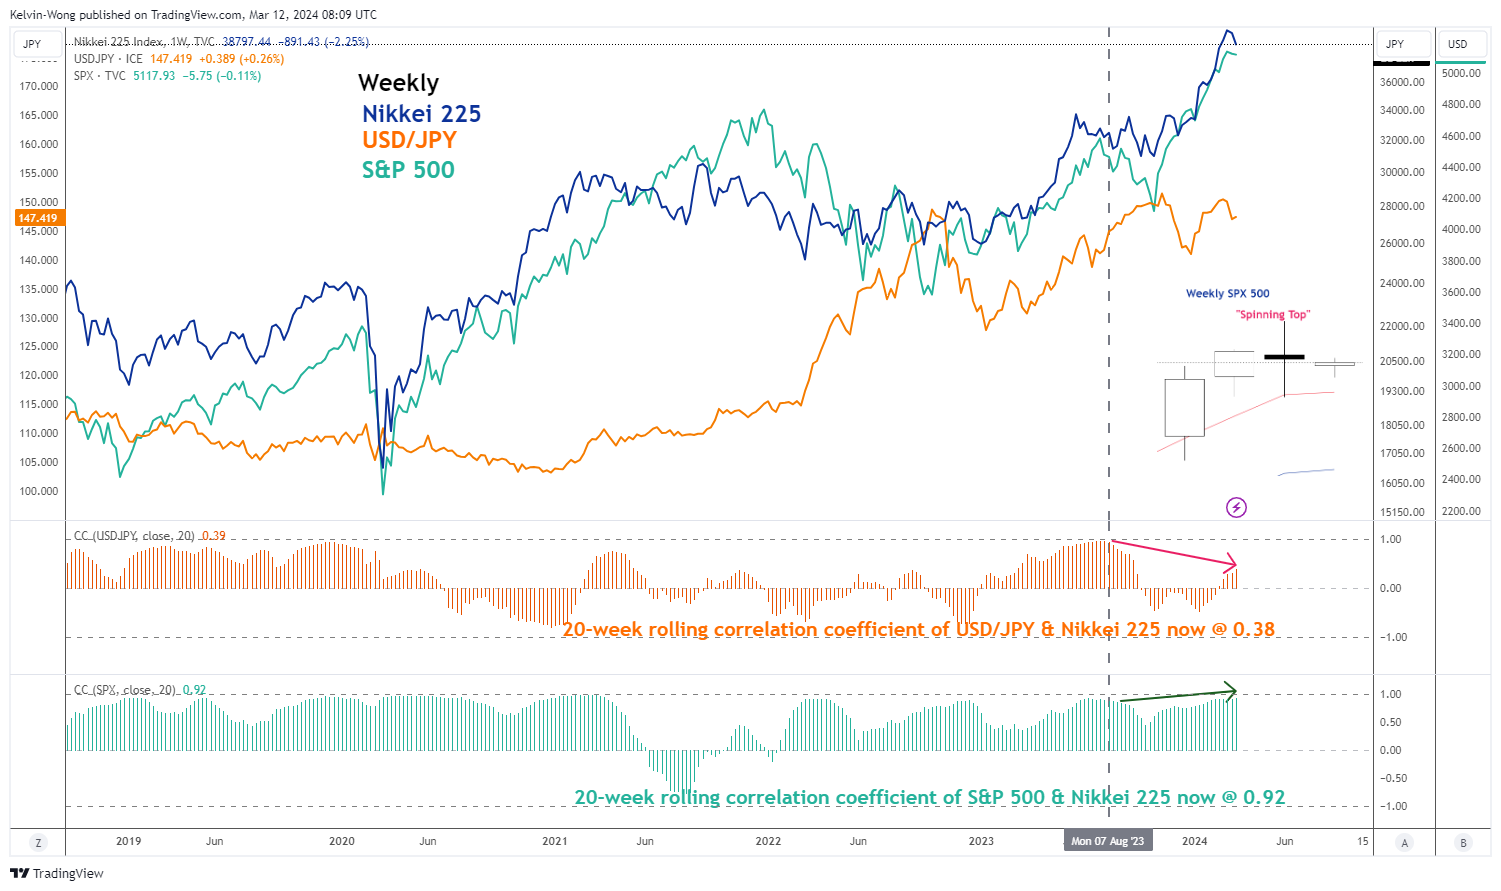
Fig 2: Nikkei 225’s correlation coefficient with US S&P 500 and USD/JPY as of 11 Mar 2024 (Source: TradingView, click to enlarge chart)
Since August 2023, the movement of the Nikkei 225 has started to move in direct lockstep with the US stock market, using the benchmark S&P 500 as the proxy; their direct correlation coefficient stands at 0.9 versus a low correlation coefficient t of 0.4 against the USD/JPY over the same period as of 11 March (see Fig 1).
The price actions of the S&P 500 have recently formed a weekly bearish “Spinning Top” candlestick pattern for the week of 4 March and coupled with other possible bullish trend exhaustion elements highlighted in our previous report, the sum of odds have skewed towards a potential impending multi-week corrective decline sequence for the Nikkei 225.
Medium-term momentum has turned bearish for Nikkei 225
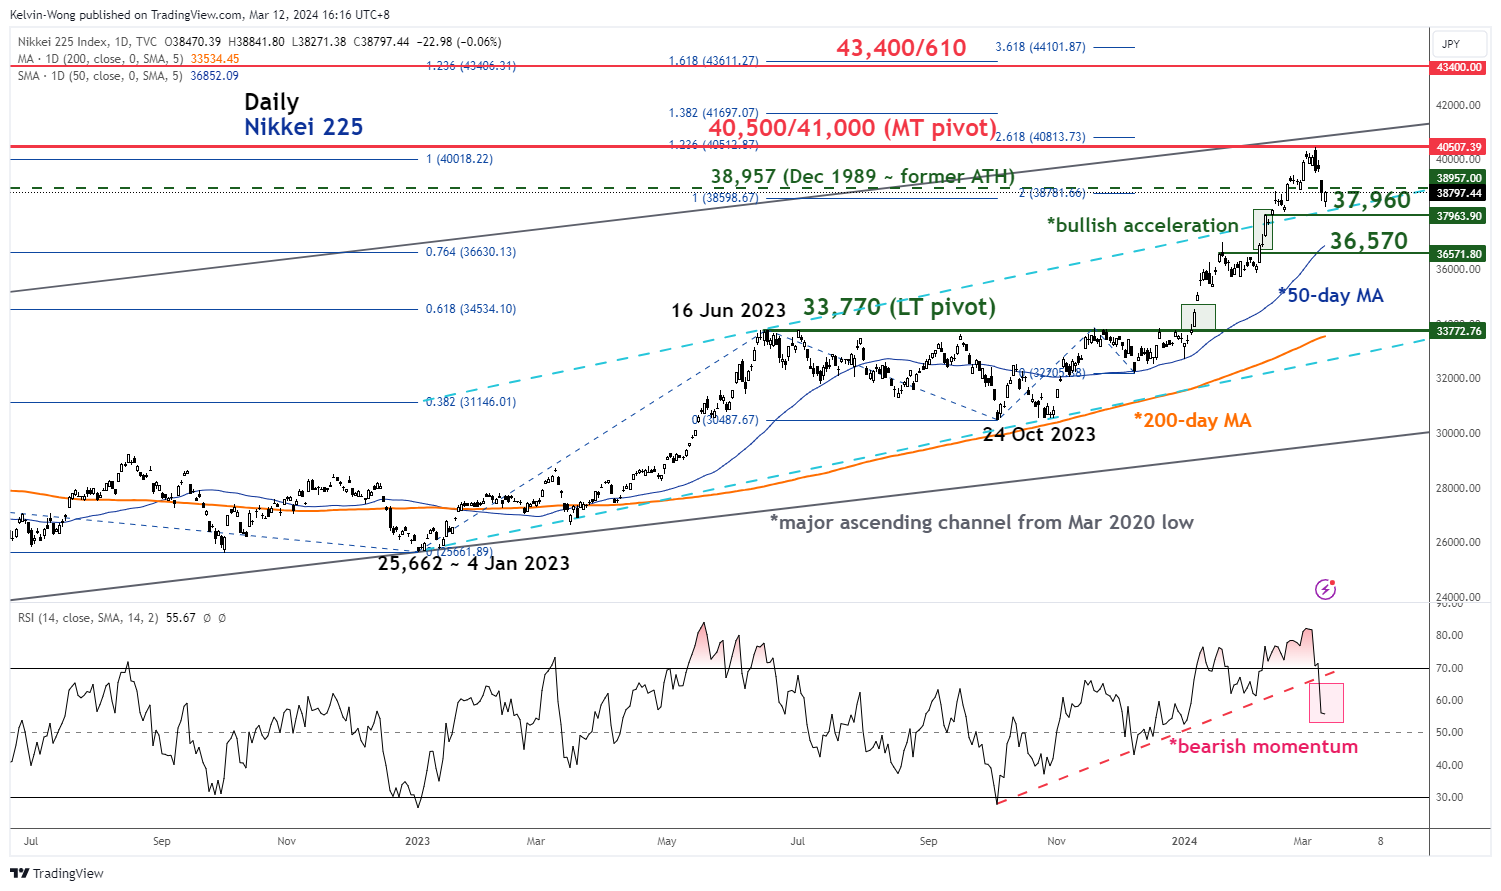
Fig 3: Nikkei 225 major & medium-term trends as of 12 Mar 2024 (Source: TradingView, click to enlarge chart)
The bullish acceleration movement of the Nikkei 225 that kickstarted on 8 February has led its price actions to almost hit a key medium-term resistance zone of 40,500/41,000 on last Thursday, 7 March (also the upper boundary of its major ascending channel in place since 6 March 2020 low).
In addition, the daily RSI momentum indicator has just staged a bearish breakdown below its parallel ascending support of the last prior rally that exited from its oversold region on 4 October 2023.
These observations suggest limited upside potential going forward and the odds favour a partial retracement of its ongoing major uptrend phase from 4 January 2023 low.
Watch the 39,640 key short-term resistance
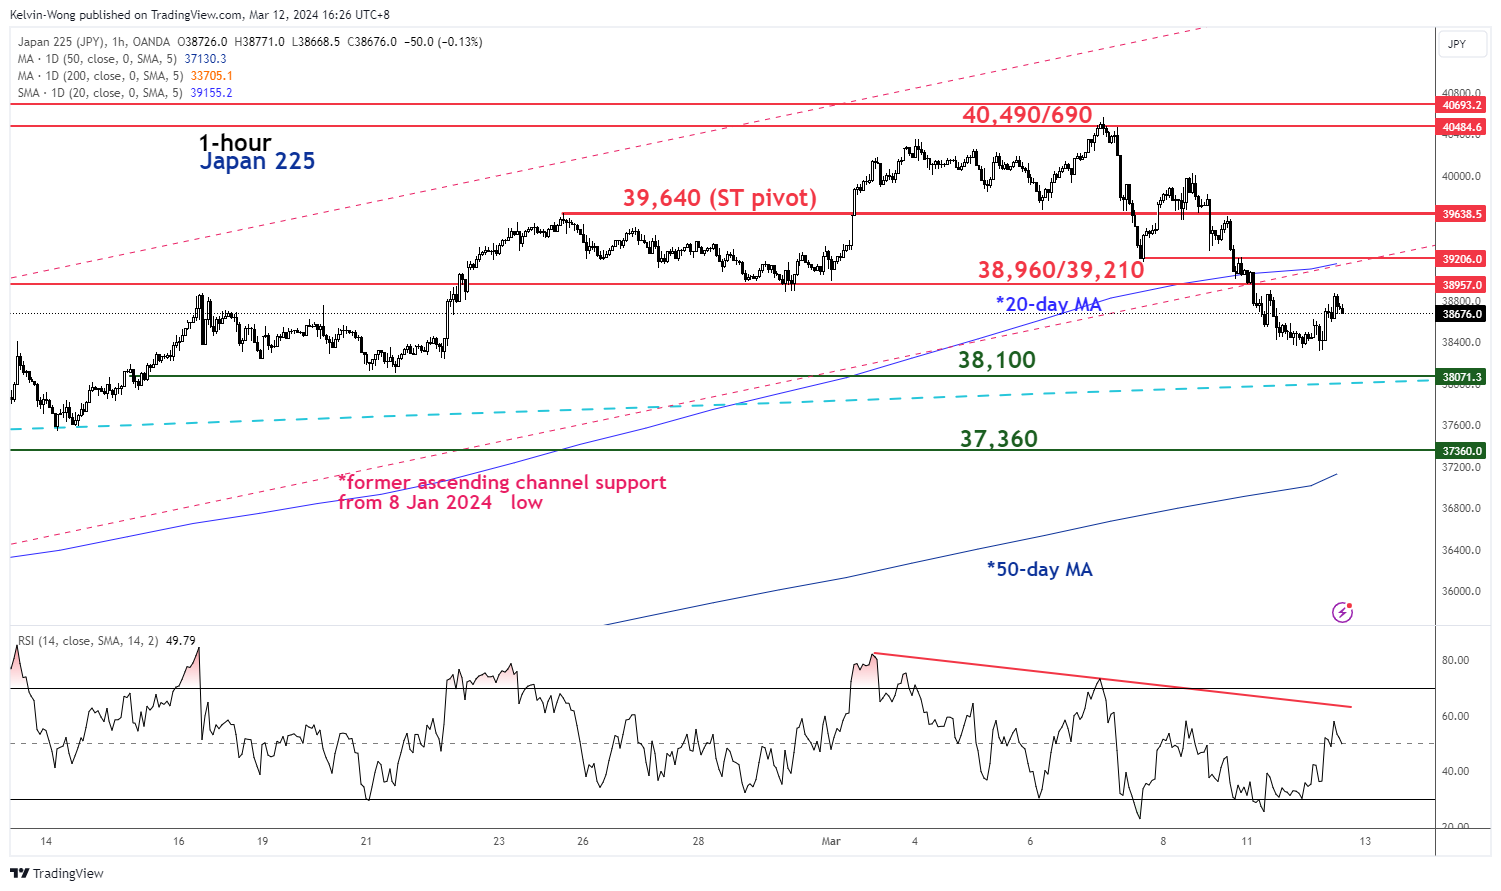
Fig 4: Japan 225 short-term trend as of 12 Mar 2024 (Source: TradingView, click to enlarge chart)
Short-term price actions of the Japan 225 Index (a proxy of the Nikkei 225 futures) have continued to remain lacklustre as it continues to trade below its 20-day moving average, and the former minor ascending channel support now both acting as a near-term resistance zone of 38,960/39,210.
If the 39,640 key short-term pivotal resistance is not surpassed to the upside, the Index may shape another potential downleg to expose the next intermediate supports at 38,100, and 37,360 in the first step.
On the flip side, a clearance above 39,640 invalidates the bearish tone for a continuation of the bullish trend to see the next intermediate resistance coming in at 40,490/690.
Content is for general information purposes only. It is not investment advice or a solution to buy or sell securities. Opinions are the authors; not necessarily that of OANDA Business Information & Services, Inc. or any of its affiliates, subsidiaries, officers or directors. If you would like to reproduce or redistribute any of the content found on MarketPulse, an award winning forex, commodities and global indices analysis and news site service produced by OANDA Business Information & Services, Inc., please access the RSS feed or contact us at info@marketpulse.com. Visit https://www.marketpulse.com/ to find out more about the beat of the global markets. © 2023 OANDA Business Information & Services Inc.
Kelvin Wong
Latest posts by Kelvin Wong (see all)
- USD/JPY: Persistent JPY bearish trend intact despite growing intervention risk - 25 April 2024
- Gold Technical: Is the bull run over after its worst daily decline in 2 years? - 24 April 2024
- Market Insights Podcast – BOJ, AU inflation, US PCE and US Magnificent 7 stocks earnings in the focus - 22 April 2024