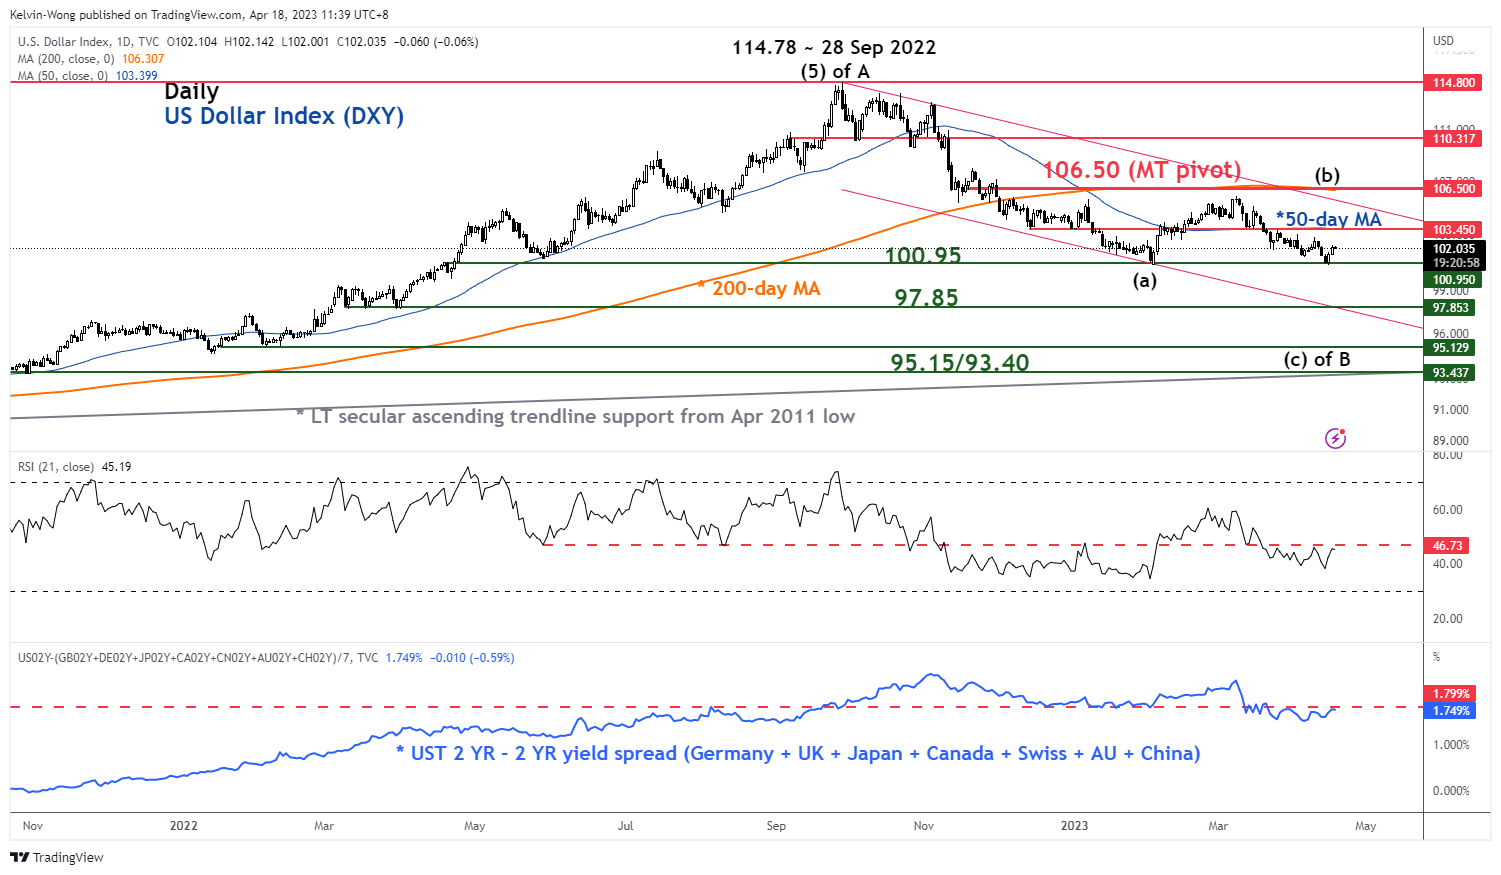
- US Dollar Index managed to hold its February 2023 low of 100.95 but the major downtrend remains intact.
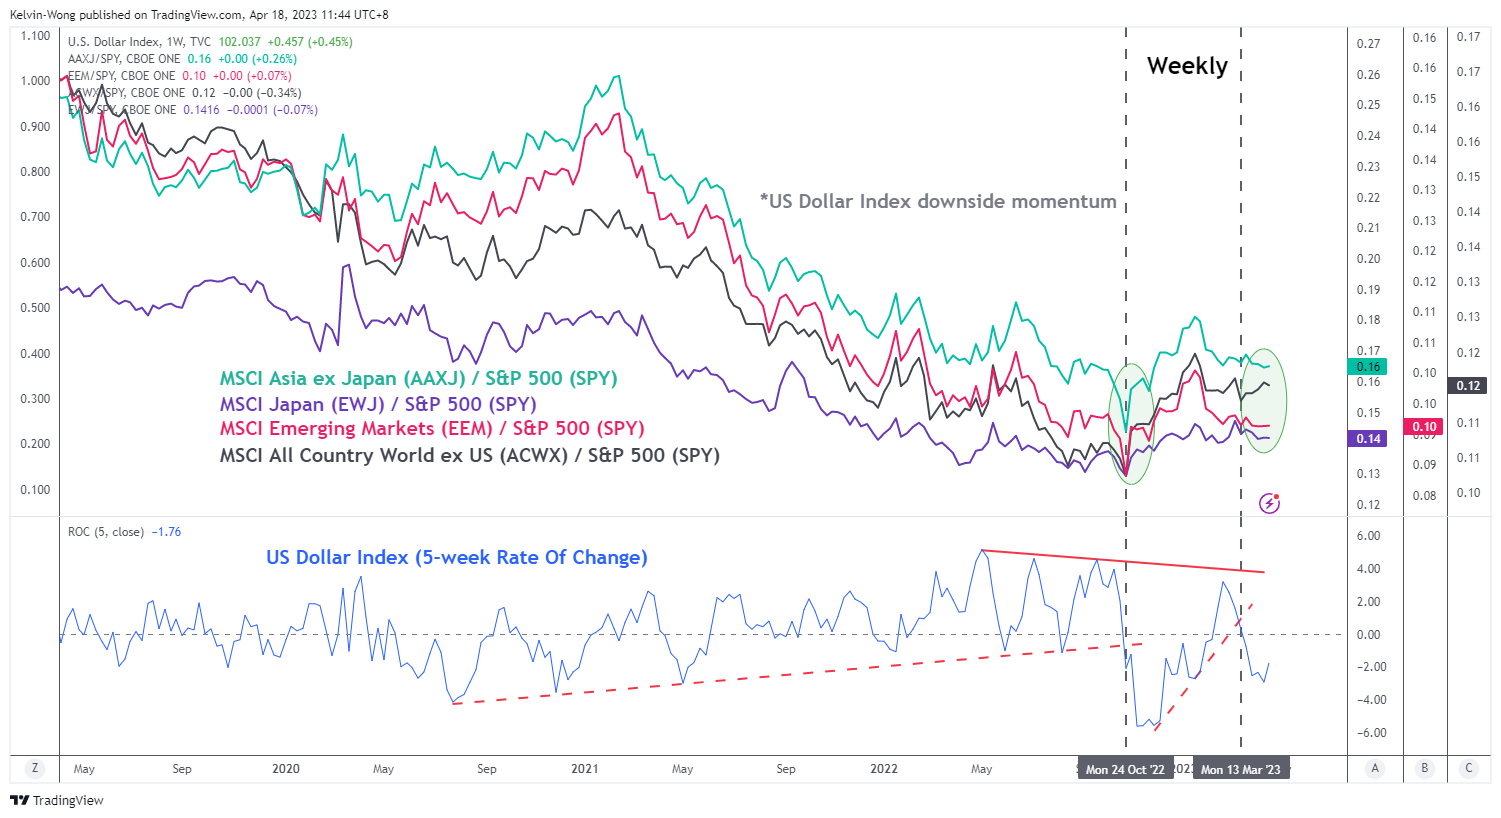
- Further US dollar weakness supports the potential outperformance of the rest of world equities against the US S&P 500.
- Hong Kong 33 has evolved into a short-term uptrend after hitting a 12-week low at end of March.
In the past two weeks, geopolitical tension has increased and reverberated across different facets such as the ongoing US-China technology trade war involving the supply of semiconductor chips and the developing countries’ growing disdain for the US dollar as a major reserve currency for international trade and debt settlement.
All these actions have upped the ante of deglobalization as developing countries sought to counter the adverse effects on their domestic economies caused by US monetary policy and reduce the risk of being held “hostage” by the US dollar-dominated SWIFT global settlement payment system.
The dethroning of the King Dollar is unlikely to take place in the next one to three years as statistics from IMF as of the end of 2022 have indicated that the US dollar accounted for more than 58% of the global currency reserves versus a mere 2.7% share for the Chinese yuan as China’s capital account has yet to be fully open for international capital flows.
However, the movements in financial markets have a non-linear aspect driven by both rational and irrational behaviour of participants. In addition, interest rates traders have increased bets the Fed may be forced to deliver its first interest rate cut in 2023 due to recent turmoil in the banking system which in turn reduced the US Treasuries yield premium against the rest of the world. Hence, further potential weakness in the US dollar cannot be ruled out in the medium-term time horizon.
US Dollar Index bears managed to stall at February 23 low but the major downtrend remains intact
Source: TradingView as of 18 Apr 2023 (click to enlarge chart)
The major downtrend of the US Dollar Index in place since its 28 September high of 114.78 remains intact as its price actions have continued to evolve within a descending channel.
Last Friday, 14 February, the prior three days’ decline of the US Dollar Index managed to stage a bounce at the 100.95 level (2 February 2023 swing low) after a retest at this crucial support. The recent four weeks of rebound of 5% from its 2 February 2023 low to 8 March 2023 high of 105.88 can be considered as a corrective rebound sequence (dead cat bounce) within its longer-term multi-month major downtrend phase with immediate resistance at 103.45 that coincides with the 50-day moving average.
Integrated technical analysis (graphical, momentum & Elliot Wave/fractals) suggests that US Dollar Index may face further downside pressure if the 106.50 key medium-term pivotal resistance is not surpassed to the upside and a break with a daily close below 100.95 is likely to see a further decline towards 97.85 support in the first step.
On the other hand, a clearance with a daily close above 106.50 damages the major downtrend phase for a potential squeeze up towards the next resistance at 110.30 (former swing low areas of 4/26 October 2022).
How does a weaker US dollar impact non-US equities?
Source: TradingView as of 18 Apr 2023 (click to enlarge chart)
The medium-term downside momentum of the US Dollar Index has resurfaced in recent weeks the via the breakdown of its former ascending support of its 5-week Rate of Change indicator on the week of 13 March 2023 and remains in a negative reading of -1.76 at the time of this writing.
A similar observation occurred earlier in the week of 24 October 2022, leading to non-US equities outperforming the US S&P 500 as illustrated by the ratio charts of respective exchange-traded funds (ETF) against the S&P 500 ETF (SPY); MSCI Asia Ex-Japan (AAXJ), MSCI Japan (EWJ), MSCI Emerging Markets (EEM) and MSCI All Country World Ex-US (ACWX).
Hence, a further potential downside movement of the US Dollar Index may lead to another round of outperformance of Asia Ex-Japan equities against the S&P 500.
China-domiciled equities form the highest weightage of 36% in the MSCI Asia Ex-Japan, let’s now decipher the movement of the Hong Kong 33 Index (a proxy for the benchmark Hang Seng Index)
Hong Kong 33 Technical Analysis – short-term uptrend from March 23 low remains intact
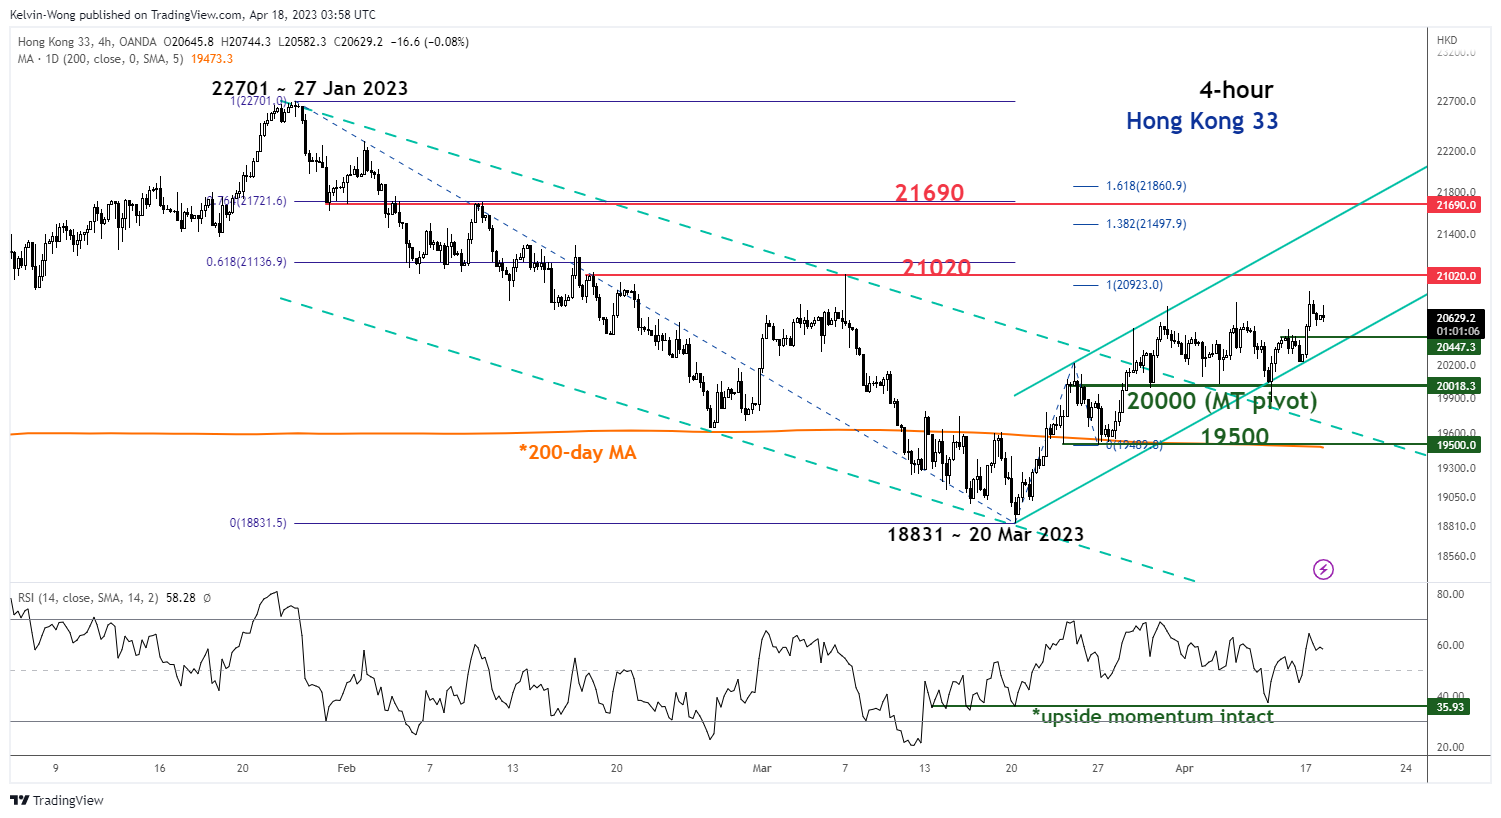
Source: TradingView as of 18 Apr 2023 (click to enlarge chart)
The Hong Kong 33 Index has started the evolve into a short-term uptrend phase as it has retested and staged a recent rebound on the key 200-day moving average on 28 March 2023 and the bullish breakout of the upper boundary (resistance)of a medium-term descending channel from 27 January 2023 high of 22,701.
In addition, short-term upside momentum remains intact as indicated by the current observations seen in the 4-hour RSI; supported by its corresponding support at the 36% level and yet to reach its overbought level of above 70%.
If the 20,000 key medium-term pivotal support holds, the Index may see a further push up toward the next resistance at 21,020 and a break above it opens up the scope for a test on the upper boundary of a short-term ascending channel in place since 20 March 2023 low at 21,690.
However, a break below 20,000 jeopardizes the bullish scenario for a side back to retest the next support at 19,500 which also confluences with the 200-day moving average.
Content is for general information purposes only. It is not investment advice or a solution to buy or sell securities. Opinions are the authors; not necessarily that of OANDA Business Information & Services, Inc. or any of its affiliates, subsidiaries, officers or directors. If you would like to reproduce or redistribute any of the content found on MarketPulse, an award winning forex, commodities and global indices analysis and news site service produced by OANDA Business Information & Services, Inc., please access the RSS feed or contact us at info@marketpulse.com. Visit https://www.marketpulse.com/ to find out more about the beat of the global markets. © 2023 OANDA Business Information & Services Inc.
Kelvin Wong
Latest posts by Kelvin Wong (see all)
- USD/JPY: An overextended intraday rally makes it vulnerable to a squeeze down with rumoured talks of FX intervention - 29 April 2024
- USD/JPY: Persistent JPY bearish trend intact despite growing intervention risk - 25 April 2024
- Gold Technical: Is the bull run over after its worst daily decline in 2 years? - 24 April 2024