EURUSD continues its attempt to reverse back above the 1.1000 level but has been unsuccessful so far, the current trading range is critical, and any real breakout may help in forecasting future price action, we will go over a long-term as well as a short-term timeframe reflecting the current price action.
Talking Points
Weekly Chart – Longer Term Patterns overview
1-Hour Chart – Short Term and current price action
Weekly Chart
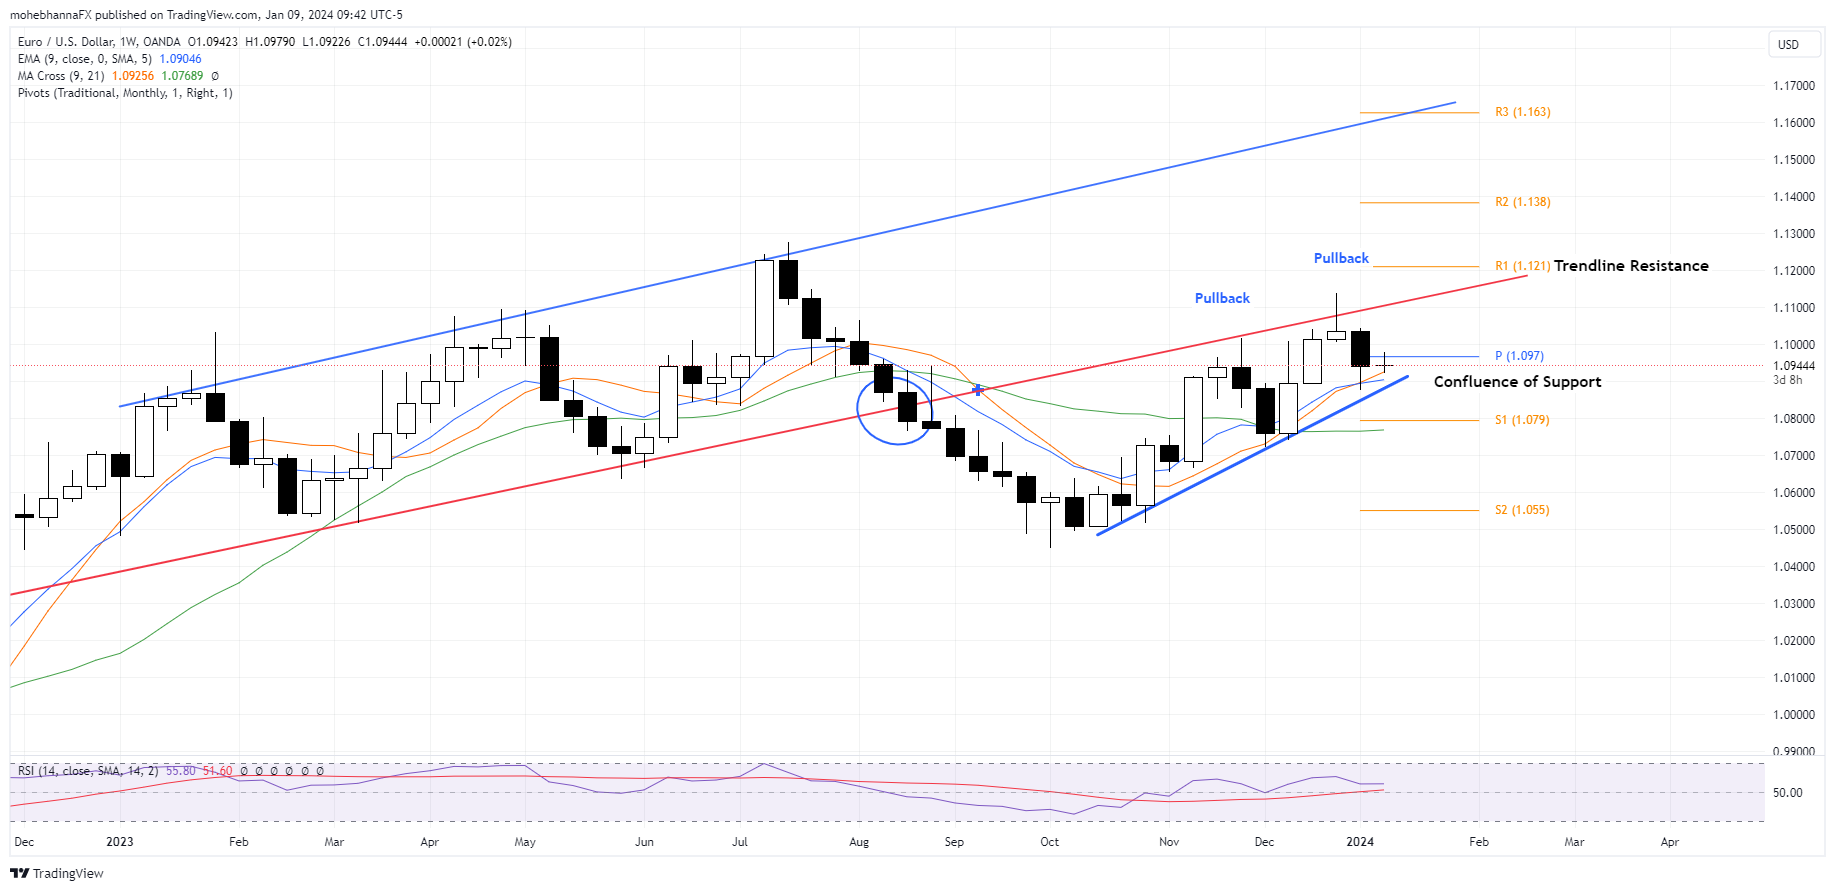
- Price continues to trade below its ascending channel as identified on the chart, Price action broke below the lower trendline in August 2023 and so far, 2 pullbacks have taken place where both times price found resistance and was unable to reenter the channel again.
- The two pullbacks are currently in a double-top formation and the connecting baseline is marked on the chart.
- A confluence of support is represented by the baseline, Monthly pivot point, and EMA9.
1-Hour Chart
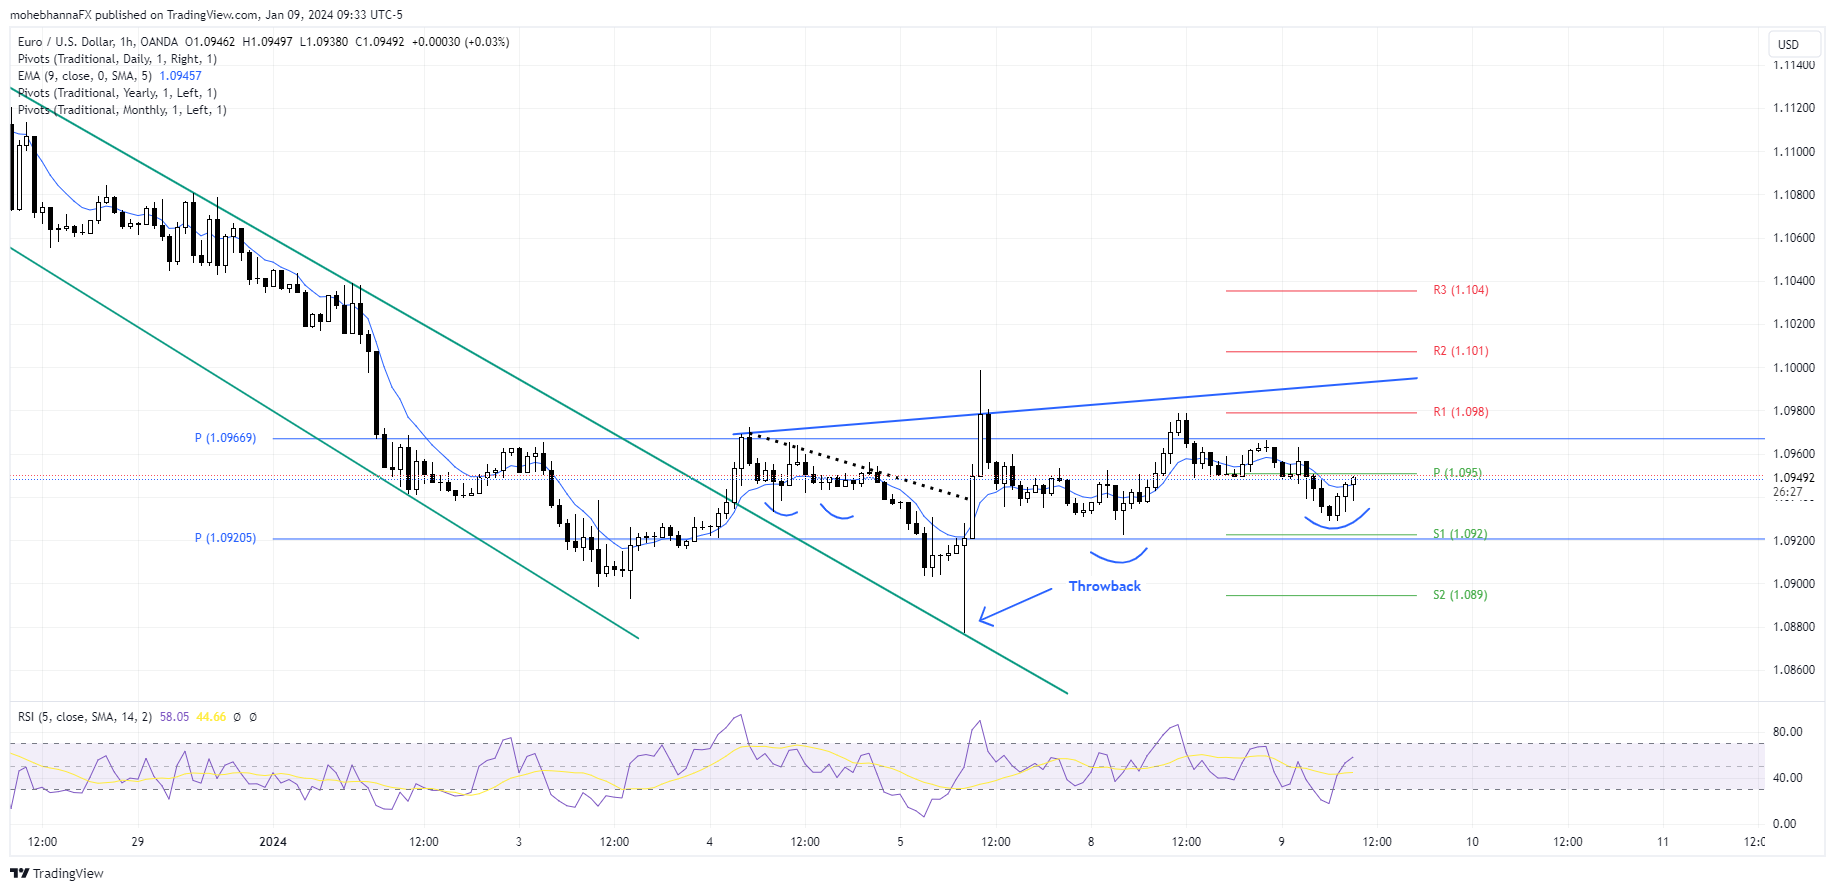
- EURUSD price action continues to trade within the range of 1.0920 – 1.0980, a confluence zone of support and resistance levels represented by monthly and annual calculations.
- Last month, December 2023, the price broke and closed above its annual pivot point of 1.0920, a critical level where the price spent an extended time trading around, the most recent EURUSD price decline in January 2024, took the rate back to 1.0920 where it is so far finding support.
- Price action broke out and closed above the upper resistance line of the descending channel (Green line), a throwback to the line took place on Friday with the Non-Farm Payroll release, however, price action found support above the green line and reversed back up.
- A triple bottom formation developed above the breakout and the price broke out again above the resistance line connecting the inverted bases for the bottoms. (Dotted black line)
- Price action is currently attempting an inverted Head and Shoulder formation, which is yet to materialize in full, the neckline lies at the 1.0980 – 1.0990 area which is the high end of the extended trading range, as well as the psychological level of 1.1000, which if penetrated along with price move following the pattern, may lead price action to the upcoming resistance levels. It is also important to remember that pattern failures can be an indication of a potential change in direction.
Content is for general information purposes only. It is not investment advice or a solution to buy or sell securities. Opinions are the authors; not necessarily that of OANDA Business Information & Services, Inc. or any of its affiliates, subsidiaries, officers or directors. If you would like to reproduce or redistribute any of the content found on MarketPulse, an award winning forex, commodities and global indices analysis and news site service produced by OANDA Business Information & Services, Inc., please access the RSS feed or contact us at info@marketpulse.com. Visit https://www.marketpulse.com/ to find out more about the beat of the global markets. © 2023 OANDA Business Information & Services Inc.
Moheb Hanna
Latest posts by Moheb Hanna (see all)
- EUR/USD Outlook Ahead of ECB Main Refinancing Rate and Monetary Policy - 11 April 2024
- US Consumer Price Index CPI – USD/JPY Technical Analysis - 8 April 2024
- BOJ Policy Rate – USDJPY Technical Analysis - 18 March 2024