The British pound has weakened on Tuesday. Currently, GDP/USD is trading at 1.3717, down 0.28% on the day.
UK economic indicators were mixed on Monday, leaving the British pound yawning. Mortgage Approvals fell to 88 thousand in August, down from 99 thousand and its lowest level since February. There was better news as credit levels in the private sector jumped from 2.8 billion pounds to 4.9 billion, marking a 12-month high.
After double-digit swings in GDP in Q2 and Q3 of 2020, the economy is expected to have stabilized in the fourth quarter. The first-estimate GDP reading indicated a modest gain of 1.0%, and this is expected to be confirmed in the final reading (Wednesday, 6:00 GMT).
US dollar rises on higher US yields
It was just one month ago that the British pound was enjoying the view above the 1.42 level. Since then, the pound has lost 3.4% of its value and is struggling to stay above the 1.37 line. The US dollar continues to receive support from US Treasury yields, which have been on the rise. Earlier on Tuesday, the 10-year yield rose to 1.77%, its highest level in 14 months.
The rise in yields comes a day before President Biden will announce parts of a proposed new infrastructure plan, Build Back Better, a massive spending program which will carry a price tag of between 3-4 trillion dollars. HSBC sent out a note saying that “stimulus and any infrastructure plan are likely to prove to be a sugar rush for the economy”. Given that such a massive recovery program will trigger higher inflation, we could see bond yields continue to rise this week, which would likely prolong the dollar rally. The Biden administration hopes to pass the plan in Congress by the summer. The massive package will undoubtedly include tax hikes, which is likely to garner strong opposition from the Republicans.
.
GBP/USD Technical Analysis
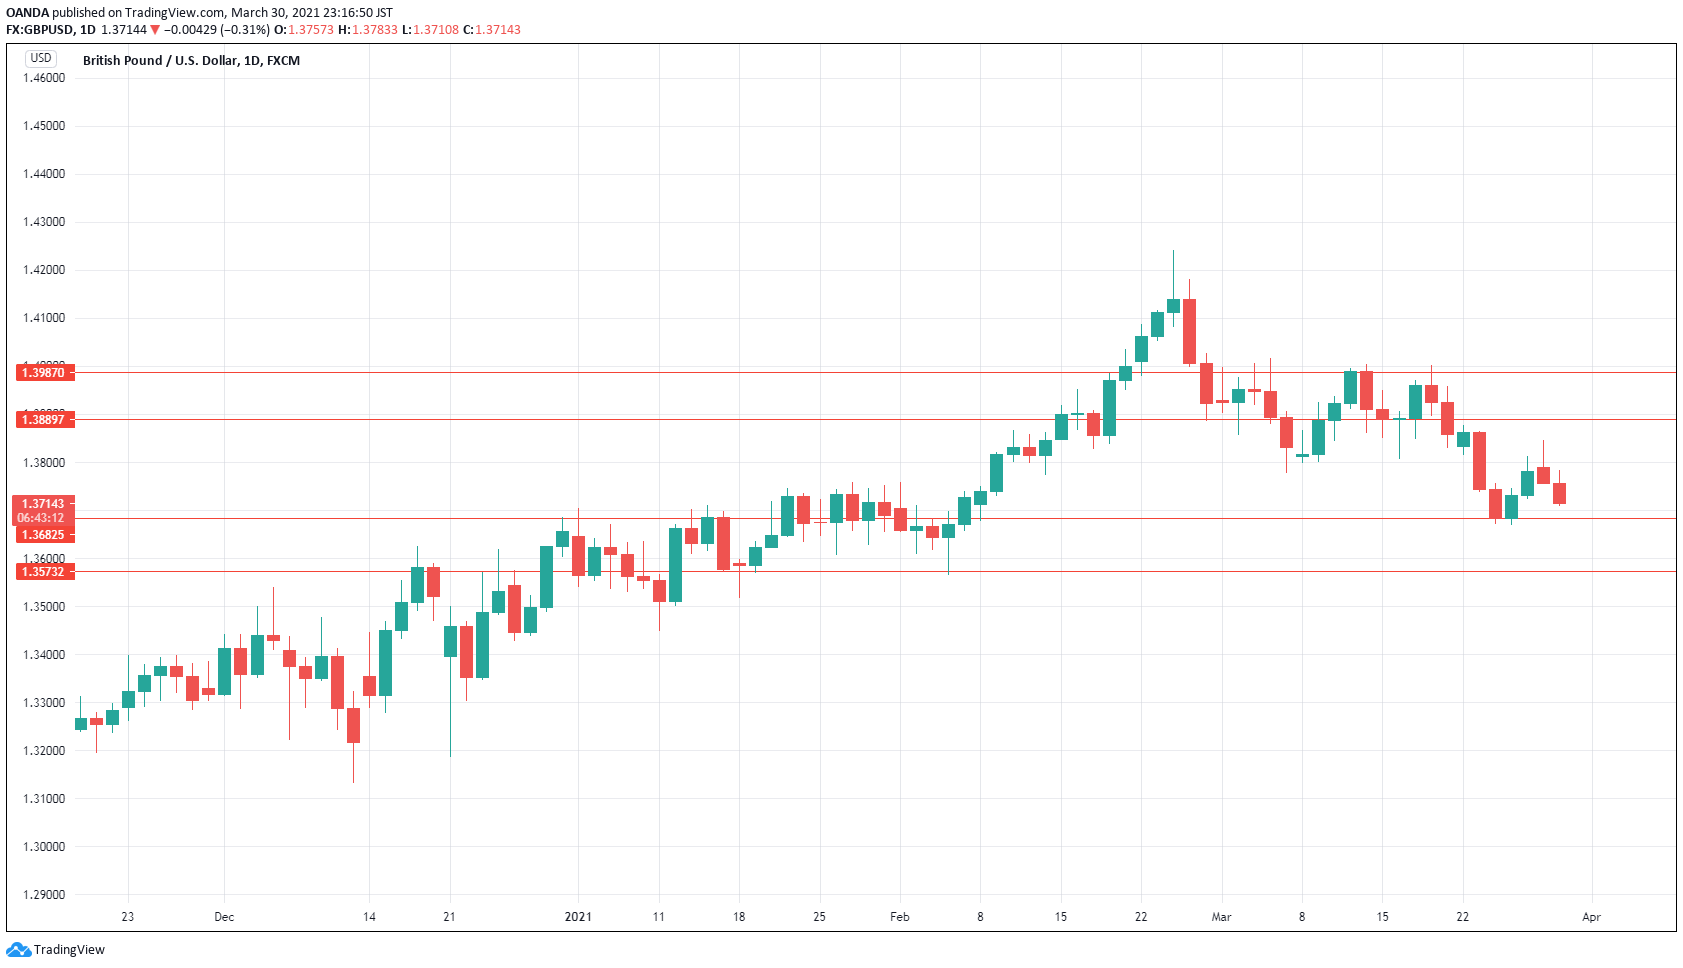
- The pair is putting pressure on support at 1.3682. A close below this level would see the pair target below the 1.36 line, with the next support line at 1.3573
- 1.3889 is the next resistance line, followed by resistance at 1.3987
For a look at all of today’s economic events, check out our economic calendar. www.marketpulse.com/economic-events/
Content is for general information purposes only. It is not investment advice or a solution to buy or sell securities. Opinions are the authors; not necessarily that of OANDA Business Information & Services, Inc. or any of its affiliates, subsidiaries, officers or directors. If you would like to reproduce or redistribute any of the content found on MarketPulse, an award winning forex, commodities and global indices analysis and news site service produced by OANDA Business Information & Services, Inc., please access the RSS feed or contact us at info@marketpulse.com. Visit https://www.marketpulse.com/ to find out more about the beat of the global markets. © 2023 OANDA Business Information & Services Inc.

Kenny Fisher
Latest posts by Kenny Fisher (see all)
- USD/JPY volatile after inflation, BoJ meeting - 26 April 2024
- Pound edges higher after soft US GDP - 25 April 2024
- USD/JPY ticks higher ahead of BoJ meeting - 25 April 2024