Official comments that the US-China Phase 1 trade deal is “close” gave risk appetite a boost last week, though a lack of updates this week has pulled energy prices from recent highs. A more positive mood has knocked safe haven assets back, but kept agricultural commodities below recent highs.
Energy
CRUDE OIL prices rose for a second straight week last week but West Texas Intermediate (WTI) has struggled this week, giving back more than last week’s gains. WTI touched the highest since September 24 yesterday but closed lower after posting the biggest intra-day loss in more than a month.
The latest data from the US Department of Energy showed US production is at record levels, but the number of US rigs in production fell to the lowest since April 2017 as at last Friday. Latest estimates suggest that the Aramco IPO will value the company at about $1.7 trillion, far less than the $2 trillion touted by Saudi Arabia at the start of the process.
Speculative investors remain bullish on the prospects for oil prices, having been net buyers for a fifth consecutive week to November 12. Net long positions are now at the highest since the week of September 17.
NATURAL GAS prices fell for a second straight week last week as the forecast of colder weather across the US faded. Prices failed to overcome the weekly moving average congestion area in the 2.7650-2.8241 window this month. The 55-week moving average is at 2.7650 and the 100-week average at 2.8241. The 200-day moving average may offer near-term support at 2.4763.
Gas inventories to November 8 showed a mere 3 billion cubic feet (bcf) added to stockpiles, well below the 5-year average of 30 bcf. Speculative investors trimmed net short positions to the least in six weeks, according to the data snapshot to November 12 from CFTC.
Natural Gas Weekly Chart
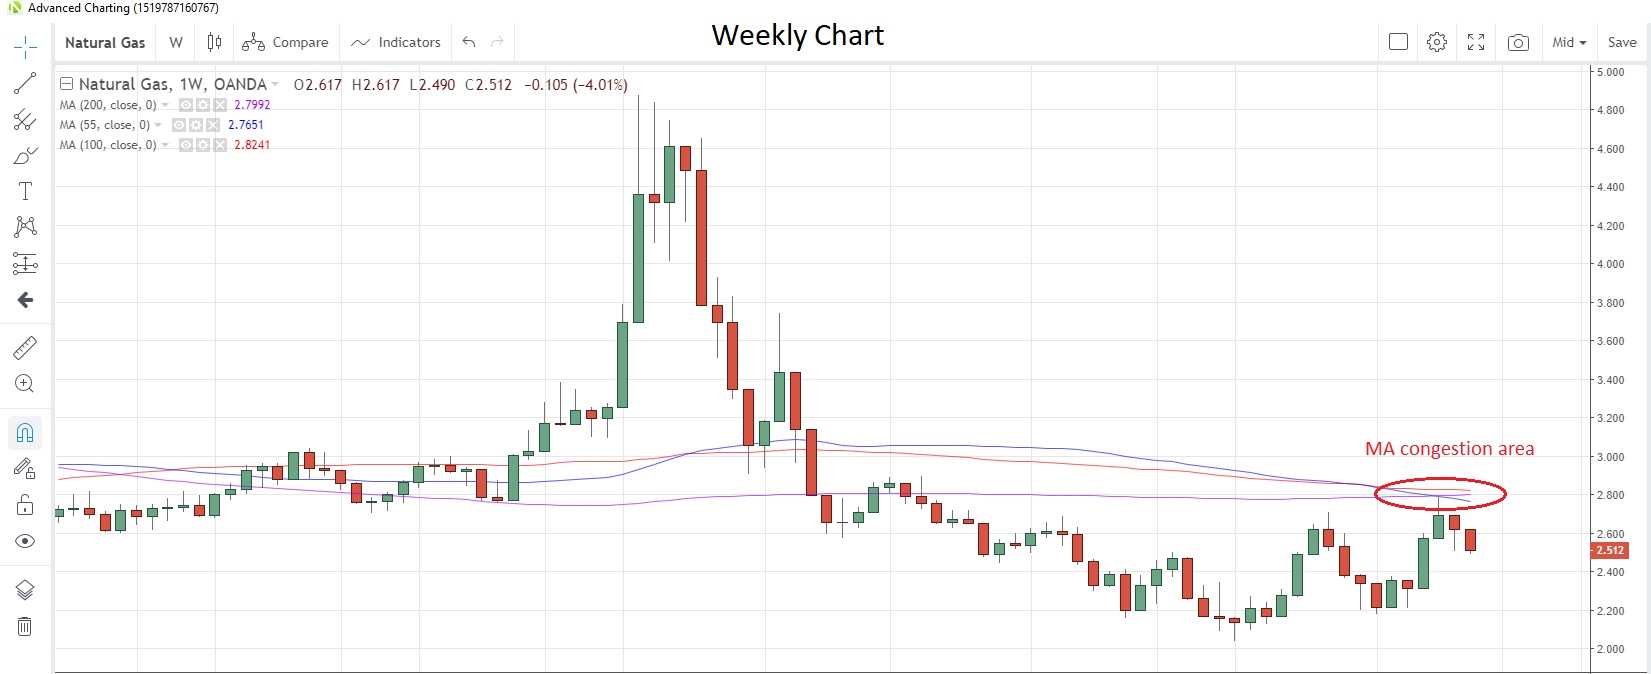
Source: OANDA fxTrade
Precious metals
GOLD has traded within the boundaries of a downward-sloping channel since August as the precious metal’s safe haven allure faded as hopes rise for an agreement on the Phase 1 US-China trade deal. The metal has traded below the 100-day moving average at 1,480.6 for the past nine sessions, with the lower bound of the channel around 1,439 today.
Investors appear to be losing patience with the precious metal as they trimmed net long positions for the first time in four weeks, according to the latest data from CFTC as at November 12. Exchange-traded funds (ETFs) have also seen divestments, with gold holdings falling last week by the most in almost three years, according to a Bloomberg report yesterday.
SILVER likewise has been treading water for the past week, holding below the 100-day moving average at 17.21. The gold/silver (Mint) ratio has also been flat-lining in an 86.0-87.0 range for the past seven sessions. Speculative investors have trimmed net long positions to the lowest since the week of July 9, the latest report from CFTC shows.
PLATINUM looks poised to advance for a second straight week this week after rebounding from 11-week lows last week. The metal tested the 100-week moving average at 871.05 but it held on a closing basis at this attempt. That moving average has supported prices on a closing basis since the week of August 26.
On a positive note, platinum miners and unions in South Africa have agreed a wage deal which will be in place for three years. The negotiations had been running since July and had raised fears of strikes and supply disruptions. Speculative investors turned net sellers for the first time in six weeks in the week to November 12, the latest CFTC data show.
PALLADIUM is consolidating the drop seen earlier this month and continues to hold above the 55-day moving average at 1,693.8. That moving average has supported prices since August 30. The shine appears to have faded for palladium, which touched record levels last month, with net long positions held by speculative investors scaled back to levels not seen since the week of September 10.
Base metals
COPPER prices are grappling with the 55- and 100-day moving averages at 2.6236 and 2.6248 respectively with the ebbs and flows of information about progress in the US-China trade talks. Copper opened below the 55-day moving average this morning for the first time in more than a month.
As the trade negotiations progress, China’s national Bureau of Statistics reported that the country’s copper output in October hit a record 868,000 tons, topping the previous record from December 2017. Copper stocks in warehouses monitored by the London Metal Exchange (LME) were the highest since October 22 last Friday.
Copper Daily Chart
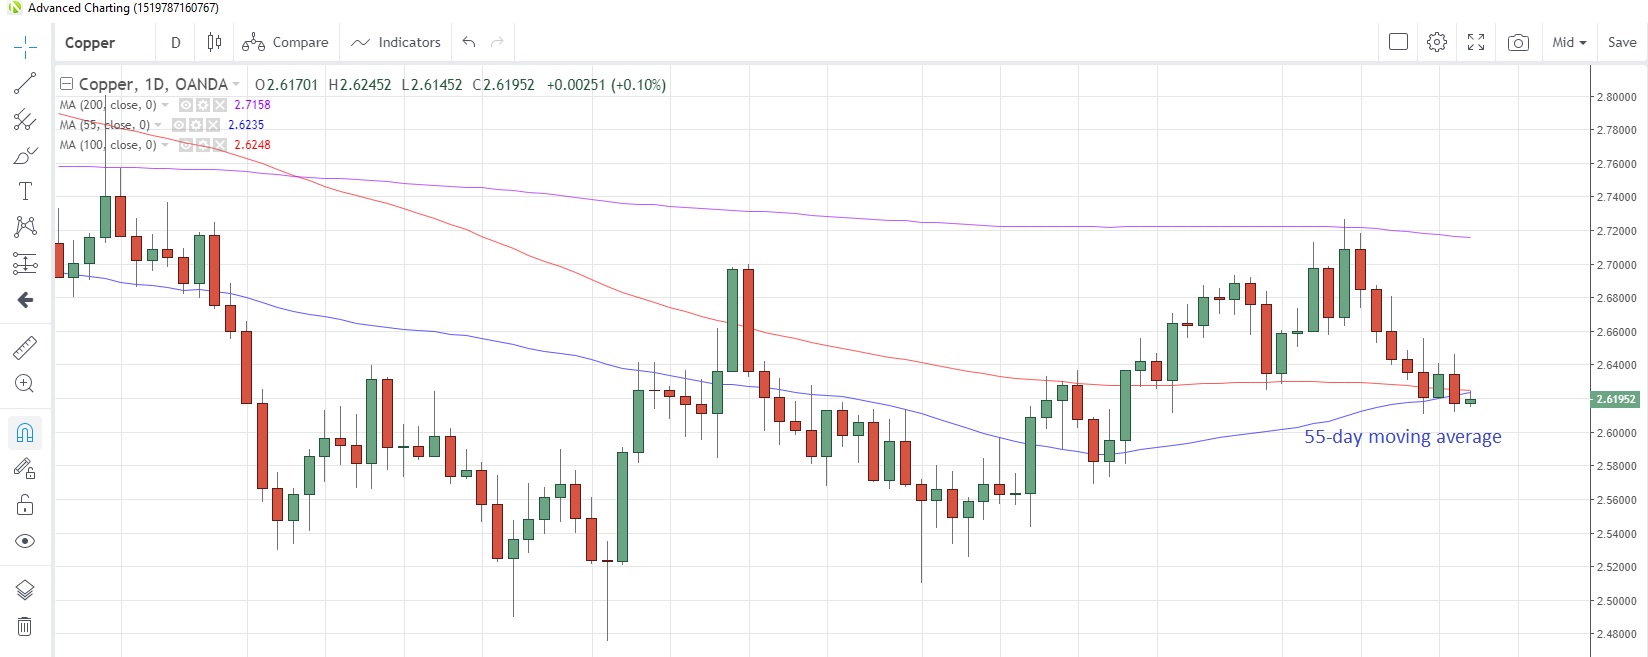
Source: OANDA fxTrade
Agriculturals
Local SUGAR supply in the US has been affected by weather damage, with the latest forecast in the World Agricultural Supply and Demand Estimates (WASDE) report from the US Department of Agriculture (USDA) suggesting a shortfall of 572.000 tons in supply. The USDA has confirmed it is working to ensure there will be enough supply for US markets.
Speculative investors scaled back net short positions for a third week, according to CFTC data as at November 12. They are now at the lowest since the week of October 1.
SOYBEANS prices have been drifting lower since mid-October and look set to fall for a third straight week this week. Prices are currently at 9.025, testing support at the 55-day moving average of 9.0086, which has supported prices since September 12, while the 38.2% Fibonacci retracement of the August-October rally is at 8.999. Speculative investors were net sellers of the commodity for a second consecutive week to November 12, CFTC data show.
Soybeans Daily Chart
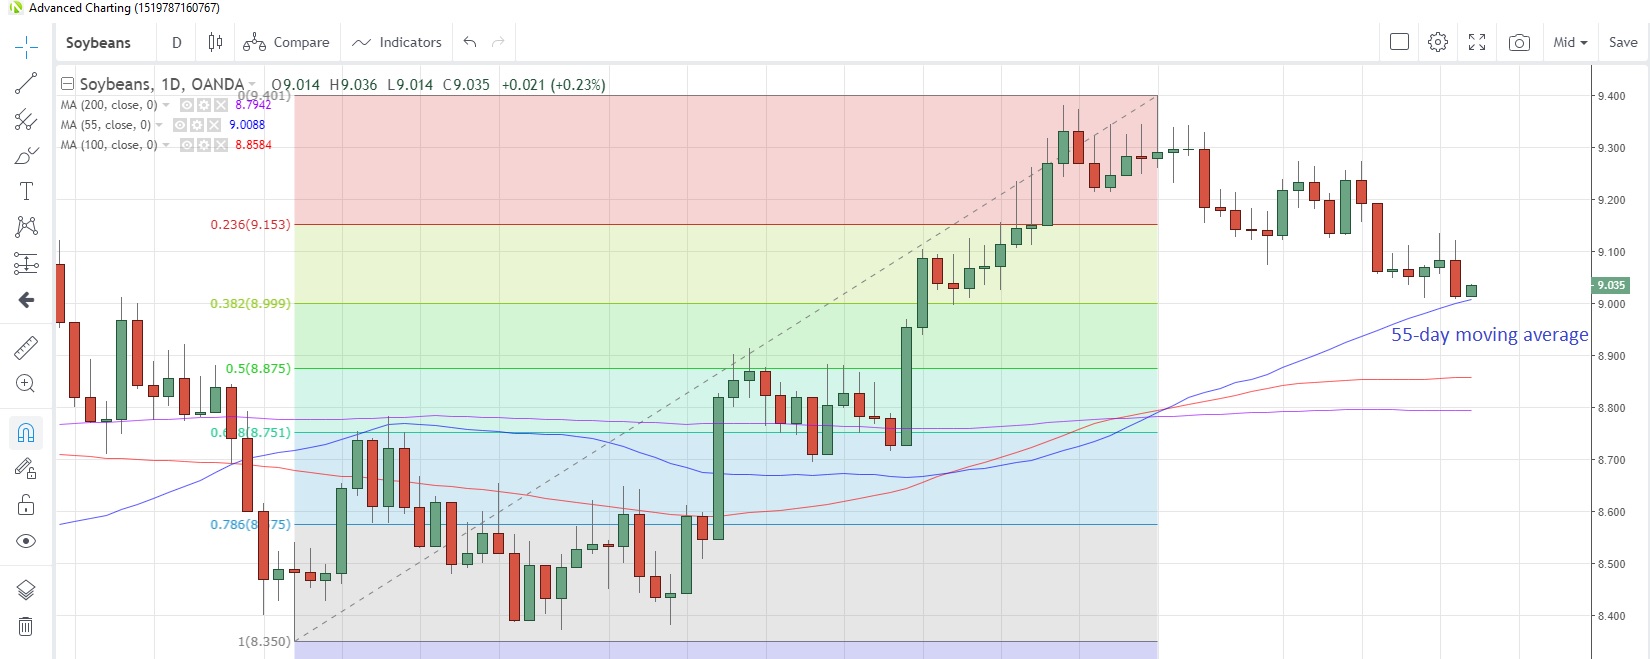
Source: OANDA fxTrade
CORN Prices have suffered once the initial euphoria about the idea of a Phase 1 trade deal wore off. It’s now facing a third weekly drop in a row and touched the lowest since September 30 yesterday. Corn is now at 3.660 with the 200-week moving average at 3.6308.
Speculative accounts sold the commodity for a second straight week to November 12, bringing net short positions to the highest since the week of September 24.
WHEAT could bring a four-week losing streak to a halt this week, if it can maintain, or improve on, current levels this week. The commodity’s drop stalled ahead of the 55-day moving average at 4.9627, which has supported prices since September 27. Speculative investors turned net buyers for the first time in three weeks in the week to November 12, the latest CFTC reports shows.
Content is for general information purposes only. It is not investment advice or a solution to buy or sell securities. Opinions are the authors; not necessarily that of OANDA Business Information & Services, Inc. or any of its affiliates, subsidiaries, officers or directors. If you would like to reproduce or redistribute any of the content found on MarketPulse, an award winning forex, commodities and global indices analysis and news site service produced by OANDA Business Information & Services, Inc., please access the RSS feed or contact us at info@marketpulse.com. Visit https://www.marketpulse.com/ to find out more about the beat of the global markets. © 2023 OANDA Business Information & Services Inc.

Andrew Robinson
Latest posts by Andrew Robinson (see all)
- RBA cuts rates on virus impact - 2 March 2020
- Commodities Weekly: Oil rises first time in eight days - 2 March 2020
- Daily Markets Broadcast 2020-03-03 - 2 March 2020