Cautious Optimism Lifting Stocks
European stock markets are a tad higher on Tuesday, mimicking moves across Asia overnight as traders adopt a cautious optimism around Brexit and the trade war.
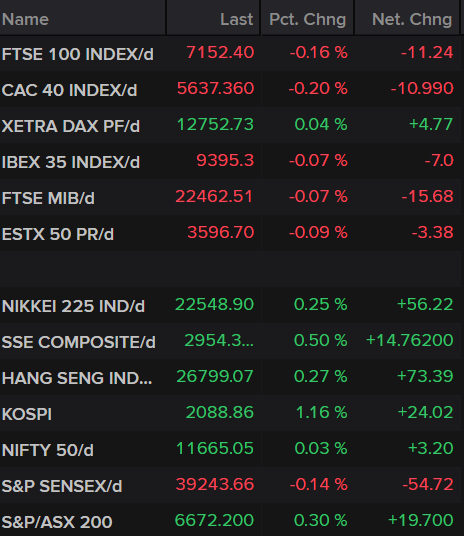
Source – Thomson Reuters Eikon
The Brexit saga rumbles on today as MPs debate and vote on the Withdrawal Agreement Bill (or WAB) in what is likely to be the first of a few excruciating and long sessions in Parliament. This process is all-too-familiar. I’m already having flashbacks to March and the various amendments and late evening votes. This will likely be more painful again.
From a trader’s perspective, the next few days may bring a few minor setbacks, but they’ll likely be viewed as more of an over-hyped procedural affair, that one that could derail a smooth Brexit.
Even if at the end of it, the deal is not ratified by Parliament, rather than leave us with no deal, it simply opens the door to an election, at which point a softer Brexit and even remain are back on the table. Not great for fans of public unity and the peaceful life but the currency may be a fan. Although some would certainly argue that a Corbyn-led government that delivers remain may be no more popular than no-deal.
Our next webinar will take place at 12.30 ET on 22 October. Sign up below.

Gold possibly nearing a breakout
The consolidation in gold continues on Tuesday, as prices continue to hover between roughly $1,475 and $1,500. The range is tightening though which gives me some hope that price will break out soon and lead to a surge in activity. The direction of the break will be very interesting.
Gold continues to look a little vulnerable in the near-term but the correction is dragging its feet which adds a layer of doubt to this. A bearish break out of this consolidation could accelerate the move though and make gold a lot more interesting.
Gold Daily Chart
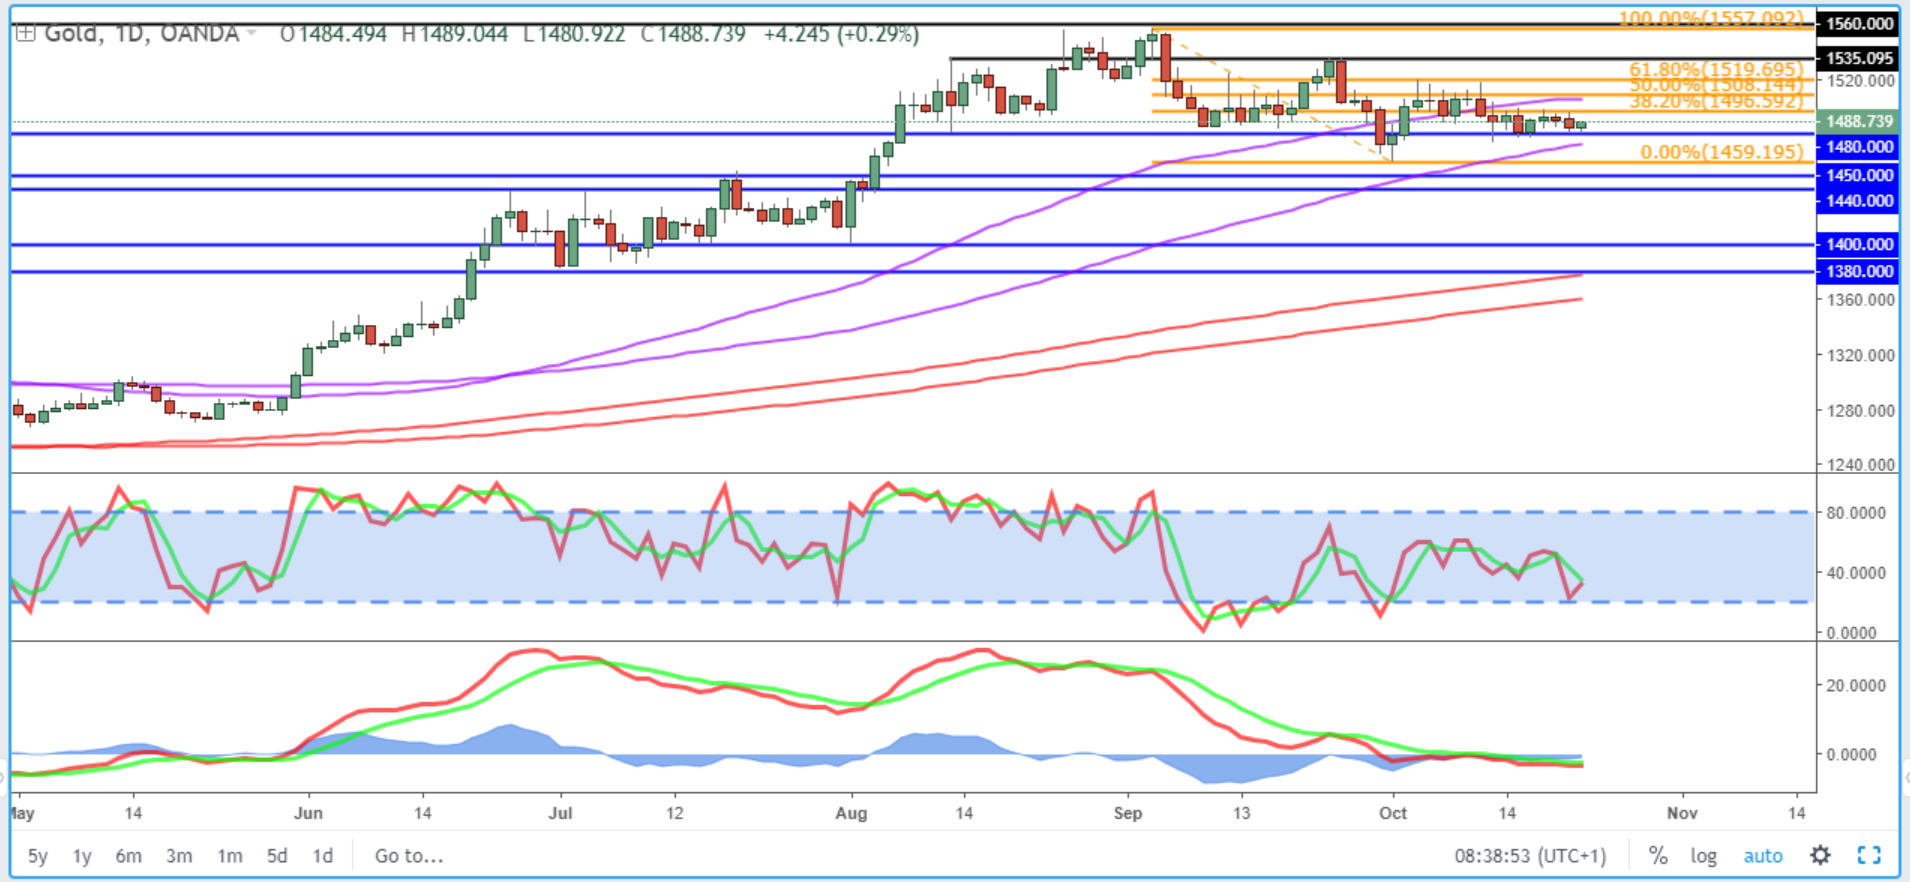
OANDA fxTrade Advanced Charting Platform
Oil prices linger around 2019 lows
Oil prices are also in consolidation mode but continue to hover around their lows, having come under severe pressure over the last six months on global growth worries. The $56-58 area below is a major area of support for Brent which, if broken, could lead to a much sharper decline. There’s little evidence that we’re going to see this breakout yet though with prices instead just consolidating in the $56-61 range.
Brent Daily Chart

Economic Calendar
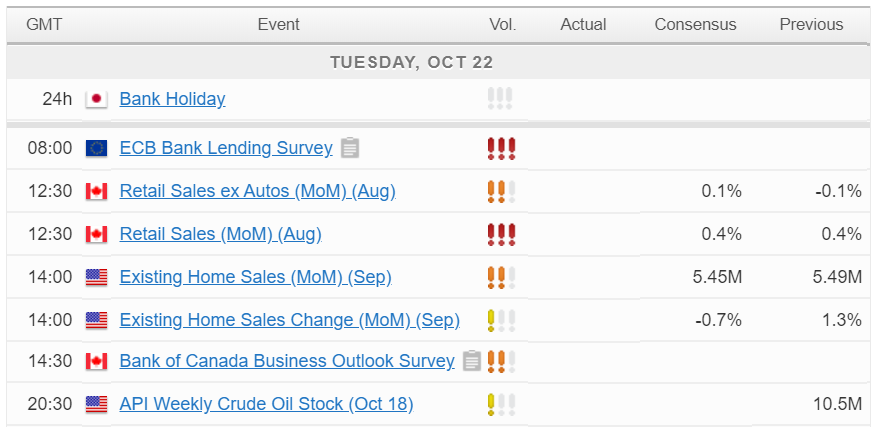
For a look at all of today’s economic events, check out our economic calendar.
Content is for general information purposes only. It is not investment advice or a solution to buy or sell securities. Opinions are the authors; not necessarily that of OANDA Business Information & Services, Inc. or any of its affiliates, subsidiaries, officers or directors. If you would like to reproduce or redistribute any of the content found on MarketPulse, an award winning forex, commodities and global indices analysis and news site service produced by OANDA Business Information & Services, Inc., please access the RSS feed or contact us at info@marketpulse.com. Visit https://www.marketpulse.com/ to find out more about the beat of the global markets. © 2023 OANDA Business Information & Services Inc.

Former Craig
Latest posts by Former Craig (see all)
- Market Insights Podcast – US GDP, RBNZ holds, bitcoin soars - 28 February 2024
- Market Insights Podcast – Nvidia earnings, record highs for stocks - 23 February 2024
- EUR/USD – A bullish breakout or just further consolidation? - 22 February 2024