The announcement that the US and China were to suspend the tariff wars and restart trade negotiations took the wind out of gold’s climb. OPEC’s determination to keep production cuts in place boosted crude oil.
Energy
CRUDE OIL prices look set to advance for a third week as OPEC nears agreement to keep current production cuts in place for an extra nine months, taking the current agreement into 2020. Prices have climbed to a more than five week high this week as Saudi Arabia and Russia have agreed to the extension, which needs ratification by non-OPEC allies at the OPEC meeting in Vienna today. West Texas Intermediate (WTI) rose the most in five months last week, but is approaching a few resistance levels. The 55-day moving average is at $59.11 and has capped prices on a closing basis since May 21, while the 100-week moving average is at $60.35. WTI is currently trading at $58.71.
WTI Daily Chart
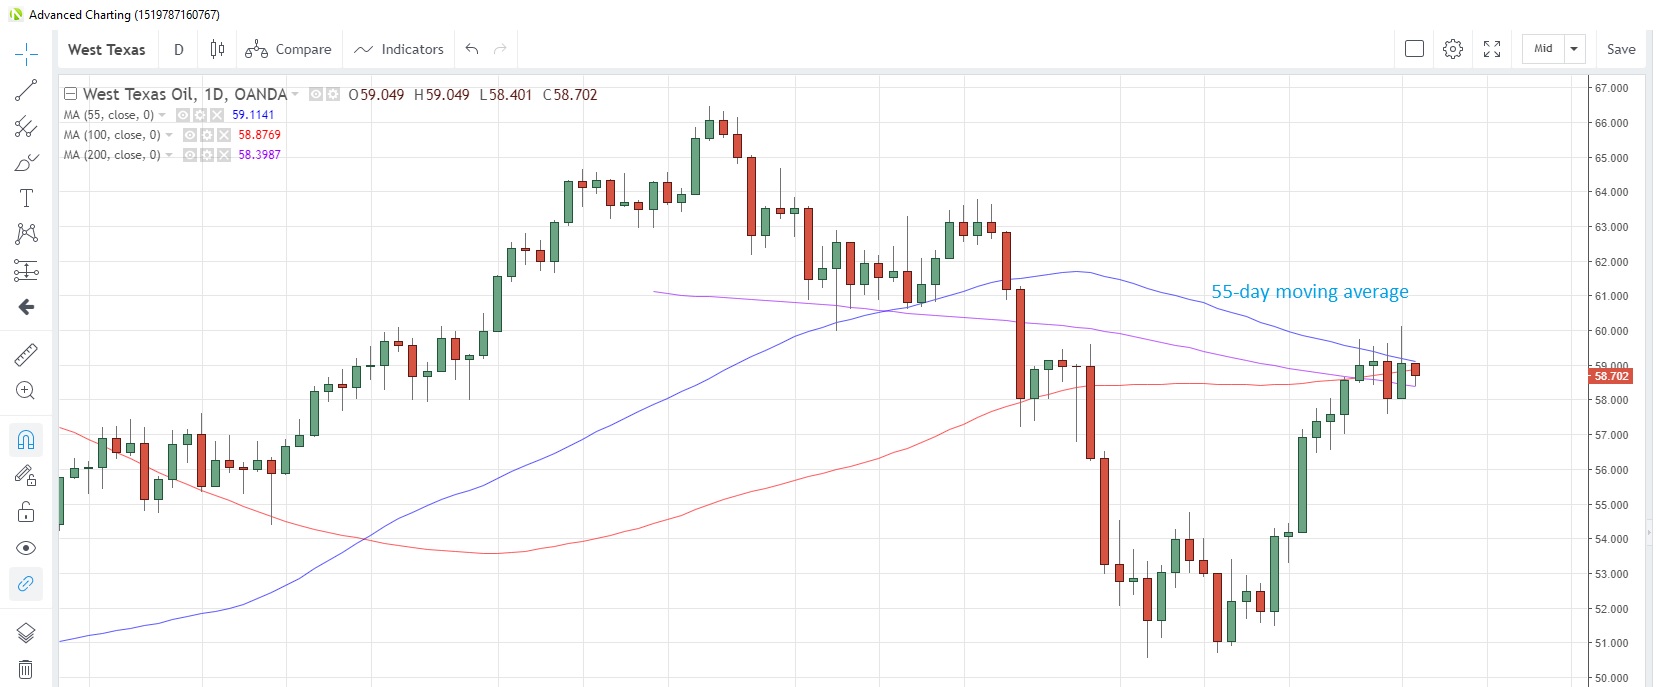
Source: OANDA fxTrade
With current cuts in place, the latest Bloomberg survey of analysts predicts that OPEC output fell to 30 million barrels per day (bpd) in June, a drop of 130,000 bpd from May. The reduced production is taking its toll on the Saudi economy, with economic growth reaching just 1.7% y/y in the first quarter, a significant drop from the 3.6% recorded in Q4 2018, with growth in the oil sector slumping to just 1% compared with 6% in Q4.
Speculative investors remain bullish on the prospects for oil, increasing net long positions for a second straight week in the week to June 25, according to the latest data snapshot from CFTC.
NATURAL GAS prices fell for a seventh consecutive month last month, the longest losing streak since 2008/09 when prices slumped a hefty 77% from peak to trough. Gas is struggling to overcome massive oversupply, particularly in the UK where wind generation is becoming competitive, while at the same time demand remains listless.
Speculative investors remain bearish, adding to net short positions for a fourth week in the week to June 25, and boosting net short positions to the highest since December 2017.
Precious metals
GOLD has fallen as much as 4% in the last week as it retreated from six year highs. Yesterday’s drop was the biggest since November 2016, pulling gold to the lowest in 12 days, after Trump and Xi announced a trade war truce and a return to the negotiating table, thereby reducing the need for safe-haven assets.
Bullish bets by speculative accounts were at the highest since September 2017, the latest data from CFTC as at June 25 show, though the recent retracement could see some speculators rushing to trim long positions in next week’s data.
SILVER has been on a downward slide since June 21 and looks poised to test 100-day moving average support at 15.10. This average has supported prices on a closing basis for the past two weeks. It’s now at 15.174.
Net long positions held by speculative accounts were boosted to the highest since the week of March 5 in the latest reporting week from CFTC, while Bloomberg reported yesterday that exchange-traded funds added 3.45 million ounces of silver to their holdings in the last trading session. That was the biggest daily increase in holdings since November last year.
PLATINUM reached the highest in 6-1/2 weeks yesterday but then succumbed to a firmer US dollar and profit-taking. The 100-day moving average resistance remains intact on a closing basis, as it has been since May 16. The 200-day moving average at 830.41 could act as an interim support level.
Speculative investors turned net buyers for the first time in eight weeks, the latest data to June 25 show, but net long positions are still near the lowest in four months.
Speculative accounts increased their net long PALLADIUM positions for a sixth consecutive week to June 25, according to CFTC data, and they are now at the highest since the week of March 26. Palladium jumped the most since OANDA began tracking prices in 2005 last month, and is currently hovering just below Friday’s high of 1,568, which in turn was a three-month high.
Base metals
COPPER climbed to a 6-1/2 week high yesterday in a knee-jerk reaction to the trade truce announcement, but gave back those gains, and more, into the close to finish in the red for the second consecutive day. Weaker China PMI readings for June dented the euphoria surrounding the trade truce. Copper is now at 2.6850 after failing to breach the 55-day moving average at 2.7365. That moving average has capped prices on a closing basis since April 30.
Copper Daily Chart
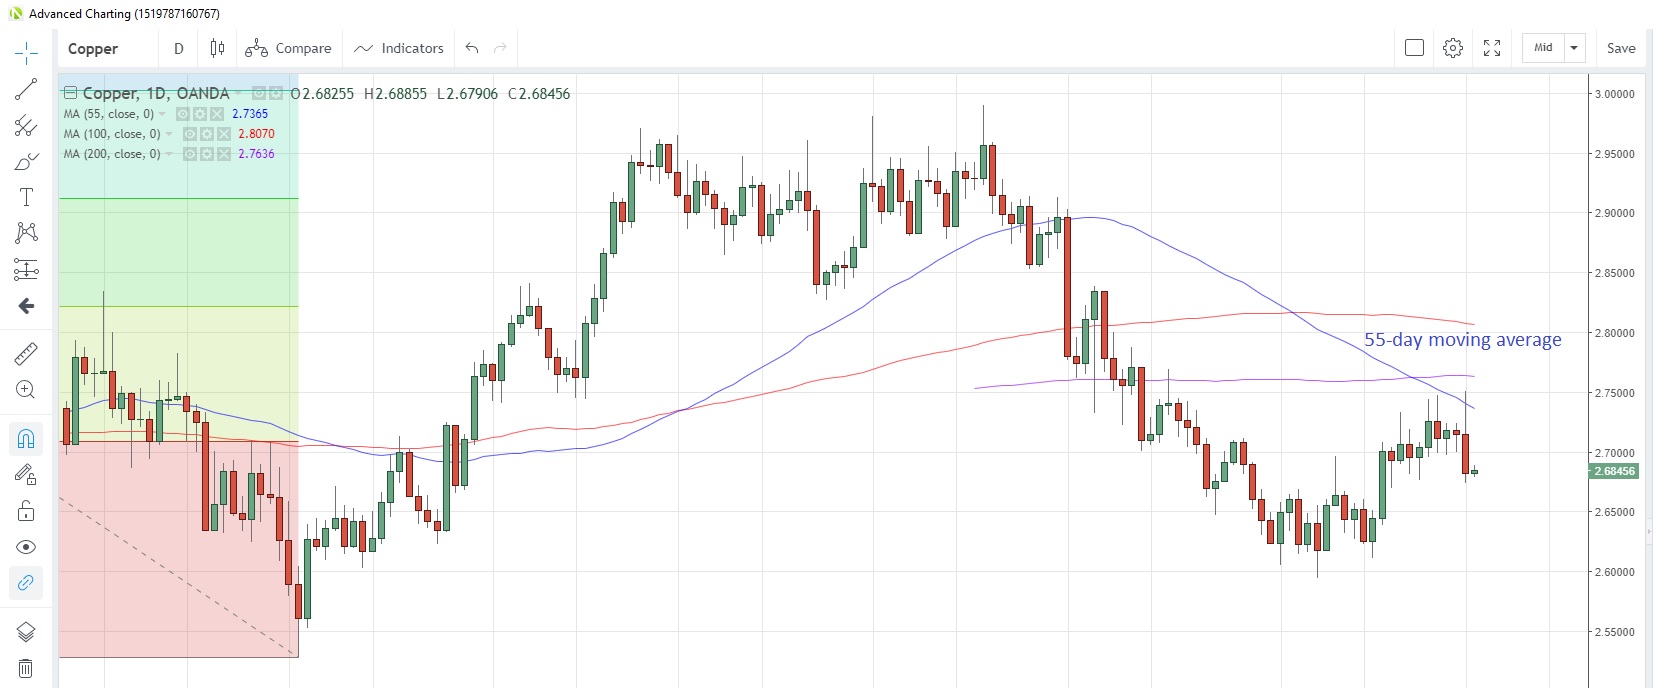
Source: OANDA fxTrade
The mine strike in Chile that had capped production for a couple of weeks ended last Friday as workers accepted a wage deal. Meanwhile, copper stocks at warehouses tracked by the London Metal Exchange fell to the lowest since June 12.
Agriculturals
WHEAT has started the second half of the year negatively and could face the first down month in three months. This retracement could force some scaling back of net long positions by speculative investors, who had built up net long positions to the largest since October 2018, according to the latest data from CFTC to June 25.
Prolonged droughts in wheat-growing areas has forced Australia to import wheat for the first time since 2007. Lower production has cut exports and supply, with 2018 exports amounting to A$4.1 billion, a 33% drop from 2017 levels.
Bloomberg reported that Rabobank has estimated that Australia’s will produce only 18 million tonnes of wheat next year. Meanwhile, Russia’s grain agency has estimated that Russia’s wheat exports are down 14% so far this season, according to a report from June 25.
Wheat Daily Chart
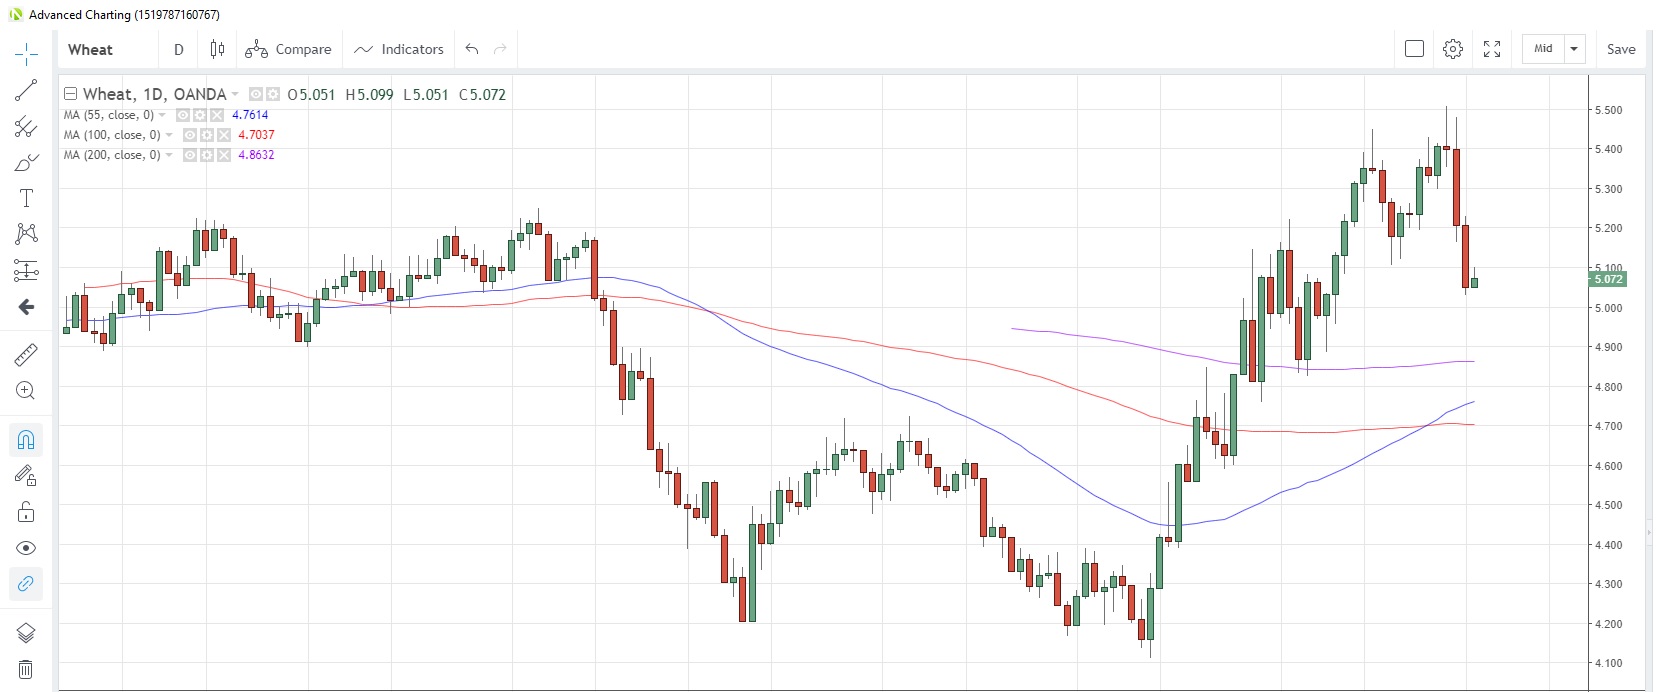
Source: OANDA fxTrade
SUGAR rose for the first time in four months in June but is struggling to maintain that momentum into this month. India’s 2019/20 sugar output is seen falling 14% to 28.2 million tons, according to estimates from the Indian Sugar Mills Association. Last week Indonesia announced a cut in import duties to 5% from 10% on sugar imports from India.
SOYBEANS have been drifting lower over the past two weeks and failed to benefit from the trade truce news. Soybeans are now at 8.848, the lowest since June 14. From the supply side, a report released by the US Department of Agriculture (USDA) last Friday estimated that planting areas were lower than expected, which could lead to smaller harvests. Speculative investors trimmed net short positions for a sixth consecutive week, data from CFTC show, and they are now at the lowest since the week of February 5.
Speculative accounts are the most bullish on CORN since June last year, adding to net long positions for an eighth consecutive week in the week to June 25, according to CFTC data. The above-mentioned USDA report highlighted that estimated corn plantings were higher than expected.
Content is for general information purposes only. It is not investment advice or a solution to buy or sell securities. Opinions are the authors; not necessarily that of OANDA Business Information & Services, Inc. or any of its affiliates, subsidiaries, officers or directors. If you would like to reproduce or redistribute any of the content found on MarketPulse, an award winning forex, commodities and global indices analysis and news site service produced by OANDA Business Information & Services, Inc., please access the RSS feed or contact us at info@marketpulse.com. Visit https://www.marketpulse.com/ to find out more about the beat of the global markets. © 2023 OANDA Business Information & Services Inc.

Andrew Robinson
Latest posts by Andrew Robinson (see all)
- RBA cuts rates on virus impact - 2 March 2020
- Commodities Weekly: Oil rises first time in eight days - 2 March 2020
- Daily Markets Broadcast 2020-03-03 - 2 March 2020