Sales growth at five-month high
AUD/USD climbed to its highest level since December 14 this morning after Australia’s retail sales for November came in above forecast. Sales rose 0.4% m/m, up from 0.3% growth in October and beating economists’ estimates of a 0.3% gain. November’s expansion was the fastest in five months. The Australian Bureau of Statistics noted outperformance by the household goods and clothing categories, both of which were impacted by strong promotional activities, including Black Friday.
AUD/USD’s rally has pushed it above the convergent 55- and 100-day moving averages at 0.7181 and 0.7179, respectively. The next technical resistance point could come at the 200-day moving average at 0.7333.
AUD/USD Daily Chart
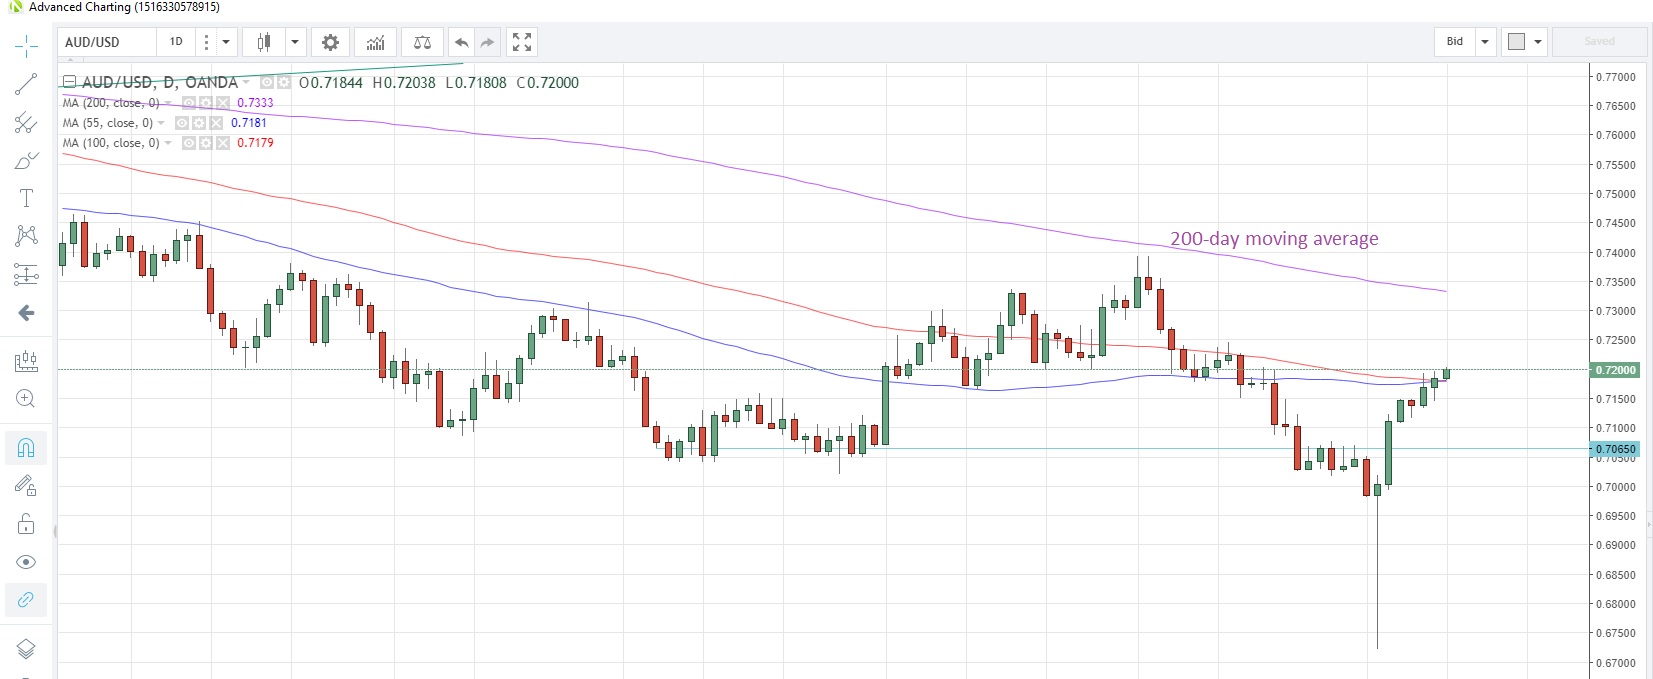
Source: OANDA fxTrade
Trump ups the border ante
Risk appetite took a marginal hit mid-morning when news hit the wires that US President Trump will most likely declare a national emergency if no border deal is struck. However, in the next breath, Trump said they should be able to do a deal with Congress. However, enough damage was done and Asian equity markets lurched in to the red, as did US futures. The US30 index slid 0.11% while the NAS100 CFD fell 0.22%.
Yuan firmer on trade talks hopes
USD/CNH slid to the lowest level since July 26 after US Treasury Secretary Mnuchin commented late yesterday, suggesting plans were in the offing for China’s top trade envoy, Vice Premier Liu He, to visit the US later this month. This implies that the progress made at the last week’s mid-level negotiations had reached a level where the big guns can get involved. USD/CNH fell to 6.7562, the lowest since July 26.
USD/CNH Daily Chart
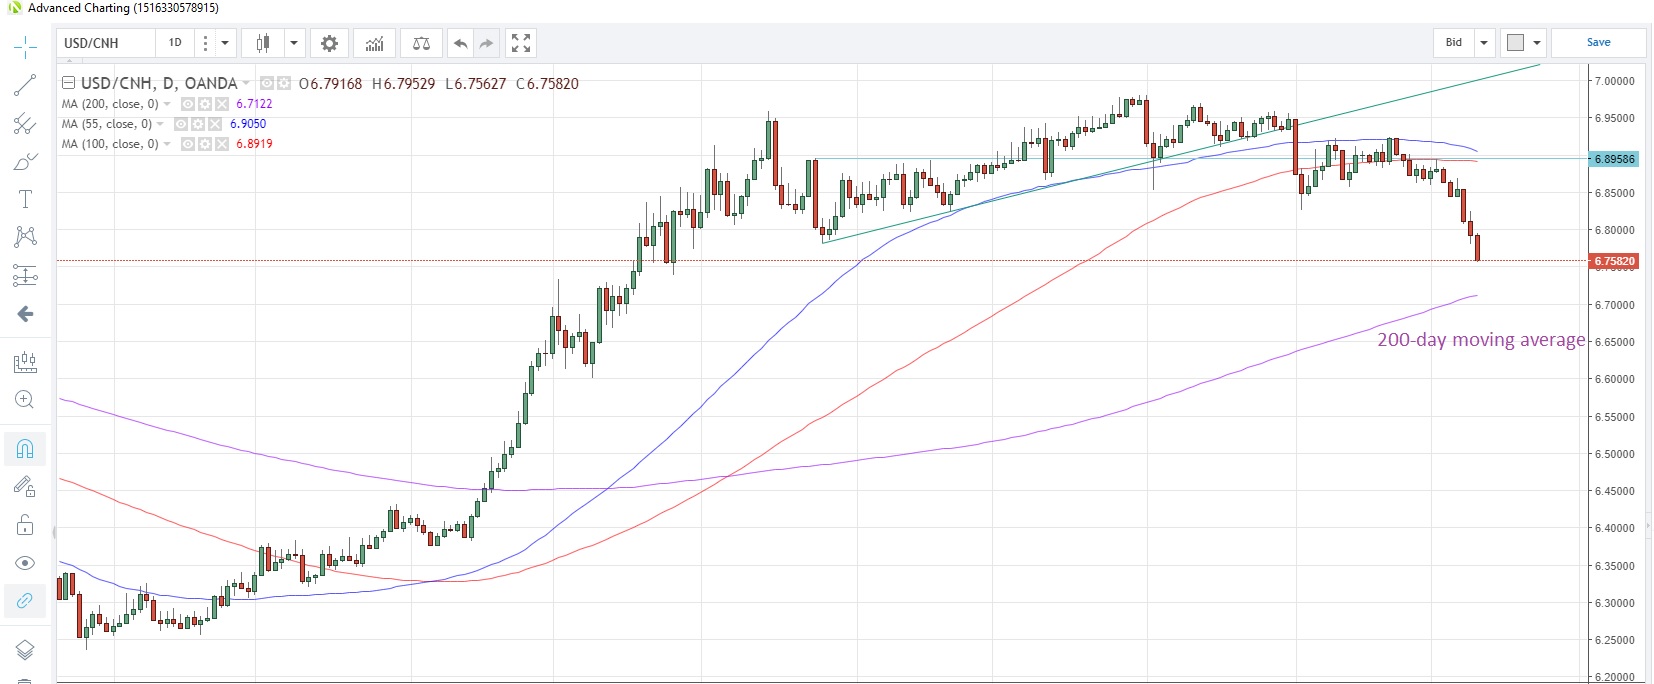
Source: OANDA fxTrade
UK production data seen rebounding
Today’s European data calendar is very UK-centric, with production data for November the headliner. Industrial production is expected to rise 0.2% m/m after a 0.6% decline the previous month while manufacturing production is seen rising 0.3% m/m following a 0.9% drop in October. The goods trade balance is forecast to show a slight improvement in the deficit to 11.4 billion pounds. NIESR also announces its 3-month rolling GDP numbers as of December.
The US calendar features US CPI data for December, with prices seen falling 0.1% m/m, the first decline in nine months.
The full MarketPulse data calendar can be viewed at https://www.marketpulse.com/economic-events/
Have a great weekend.
Content is for general information purposes only. It is not investment advice or a solution to buy or sell securities. Opinions are the authors; not necessarily that of OANDA Business Information & Services, Inc. or any of its affiliates, subsidiaries, officers or directors. If you would like to reproduce or redistribute any of the content found on MarketPulse, an award winning forex, commodities and global indices analysis and news site service produced by OANDA Business Information & Services, Inc., please access the RSS feed or contact us at info@marketpulse.com. Visit https://www.marketpulse.com/ to find out more about the beat of the global markets. © 2023 OANDA Business Information & Services Inc.

Andrew Robinson
Latest posts by Andrew Robinson (see all)
- RBA cuts rates on virus impact - 2 March 2020
- Commodities Weekly: Oil rises first time in eight days - 2 March 2020
- Daily Markets Broadcast 2020-03-03 - 2 March 2020