Precious metals
PALLADIUM continues to be preferred by speculative investors, with net long positions reaching their highest since July 10. The commodity is enjoying a strong bullish streak, rising for seven straight sessions and posting gains of 8.5% in that period. Palladium touched 1,065.19 this morning, its highest level since February, and is now at 1,063.10.
Palladium Daily Chart

Source: Oanda fxTrade
GOLD continues to pivot around the 1,200 mark and is still capped by the 55-day moving average, as it has been since April 23. Gold still trades at the mercy of the US dollar’s direction and, despite the turmoil of the US-China trade war, has struggled to gain any traction as a safe haven asset.
Speculative accounts increased their net short positions in the week to September 18, adding a net 3,254 contracts, according to the latest CFTC data released last Friday. In a report issued last week, the World Gold Council noted that central banks had been active buyers of gold in the first half of 2018, accounting for 10% of total demand, and made the most first-half purchases since 2015. NOTE: The average monthly closing price of gold in H1 2015 was 1,204.66. Gold is currently trading at 1198.66.
In contrast to gold, speculative accounts reduced their net short SILVER positions for a second straight week, according to the September 18 snapshot. Silver has been trading in a narrow 14.00 to 14.40 range for almost three weeks and this tight range has seen the Gold/Silver (Mint) ratio move according to gold’s gyrations. The ratio has eased back from 10-year highs struck on September 11 as gold dipped below $1,200 again.
PLATINUM’s rally this month appears to be stalling ahead of the 100-day moving average at 844.28. The precious metal hit a 6-1/2 week high of 839.16 last Friday and has traded below the 100-day moving average since March 27. Speculative net short positioning was scaled back for a second week to September 18, bringing net shorts to their lowest since June 19.
Base metals
The escalation in the US-China trade war has taken the wind out of the sails of COPPER’s nascent rebound from 15-month lows. The industrial metal peaked at 2.8411 near-term last Friday is poised for its second straight day of declines. The 100-day moving average is at 2.8530 and continues to keep the metal at bay, as it has done since June 19. The stochastics momentum indicator is giving off bearish signals (indicator is falling, dropping through overbought threshold) so there is a chance that the retracement has further to run, especially given the grim outlook for any solution to the US-Sino trade war in the near term. Speculative short positioning is at its lowest in three weeks and is a minimal 191 contracts.
COPPER Daily Chart
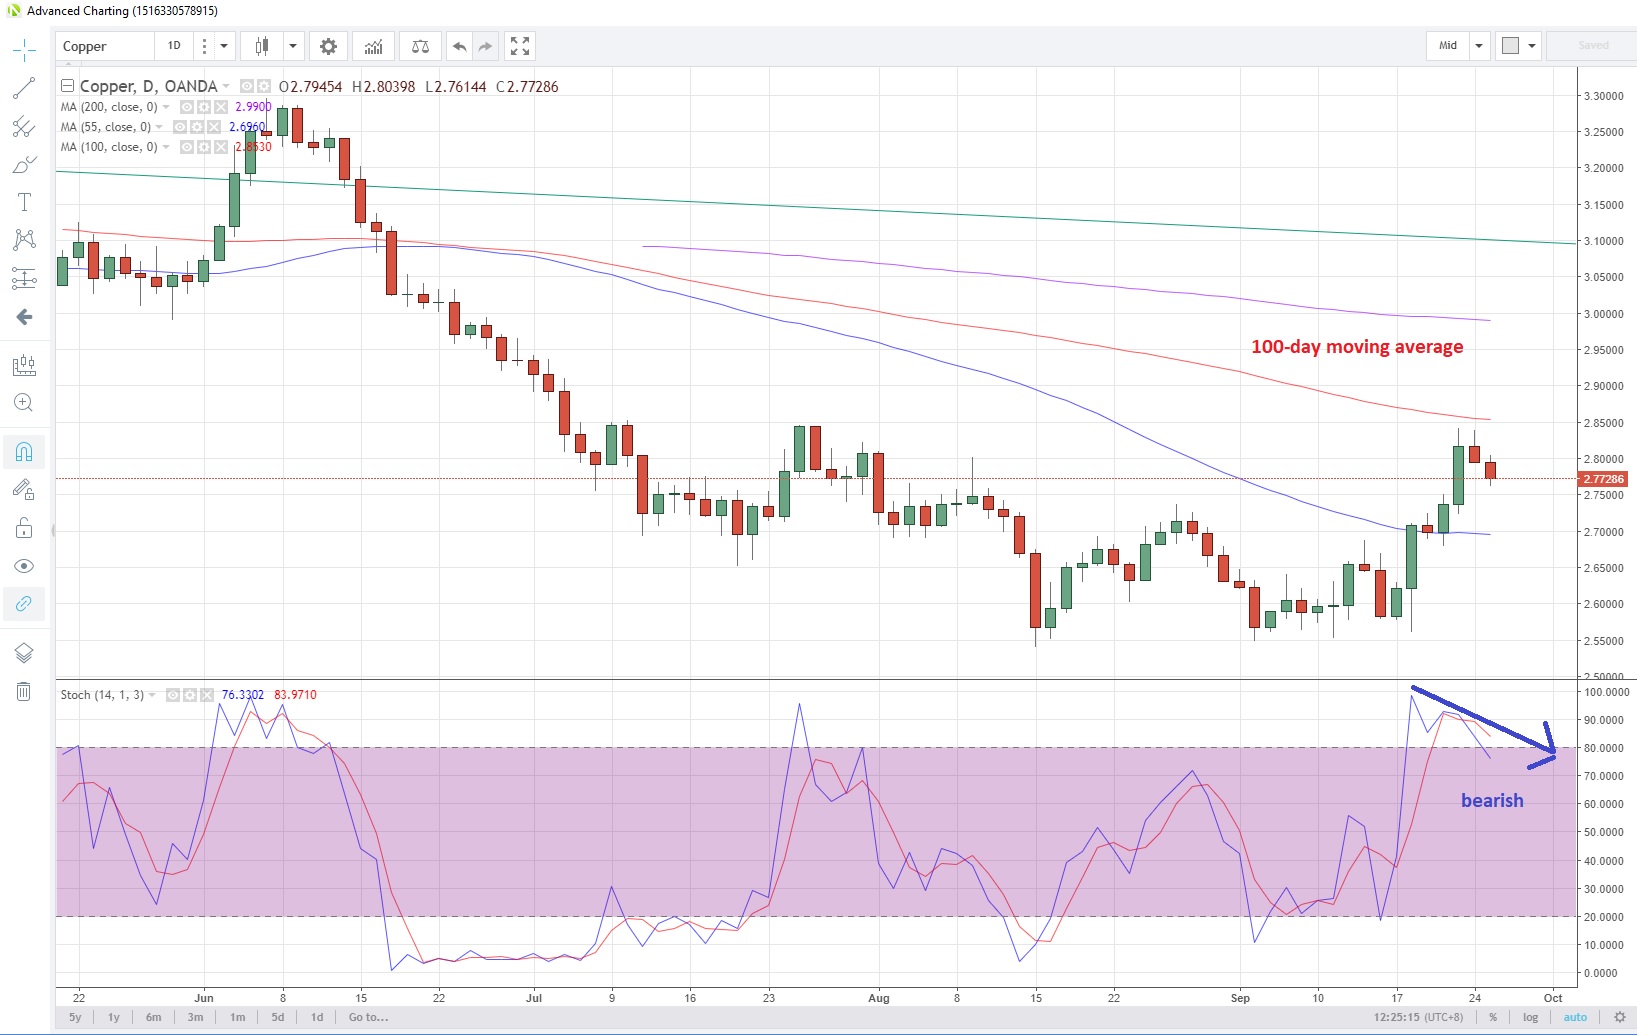
Source: Oanda fxTrade
Energy
NATURAL GAS has surged to a seven month high, breaking above the 55-month moving average for the first time since February. Above-average temperatures is keeping the demand for cooling above the five-year norm, according to Bloomberg.
EIA reported a storage build of 86 billion cubic feet for the week ending September 14. That’s the largest weekly increase since the week to June 15. For Thursday’s data, initial forecasts are suggesting a smaller build of 78 billion cubic feet in the week to September 21.
Earlier this week, Total announced a discovery of a new major offshore gas field close to an existing field offshore of the UK, which means it can be developed quickly and at a relatively low cost.
CRUDE OIL continues to power ahead despite the imposing of the second phase of tit-for-tat tariffs by US and China. Concerns about any future impact on global growth, and hence demand, have been overshadowed by supply concerns. Markets continue to fret about the potential shortfall once Iran supply is taken out of the equation from November 4. Bloomberg has calculated that China’s average demand (refinery output + net imports) rose 5.4% y/y in August.
West Texas Intermediate rose to an eleven-week high of 72.98 yesterday and looks to be on track to test the 100-month moving average at 74.49. This moving average was last tested in June and July and held. Brent crude powered through the 80 mark easily yesterday and is now consolidating at 81.30. The spread between the two crudes has been steady around nine points for the past week.
WTI Daily Chart
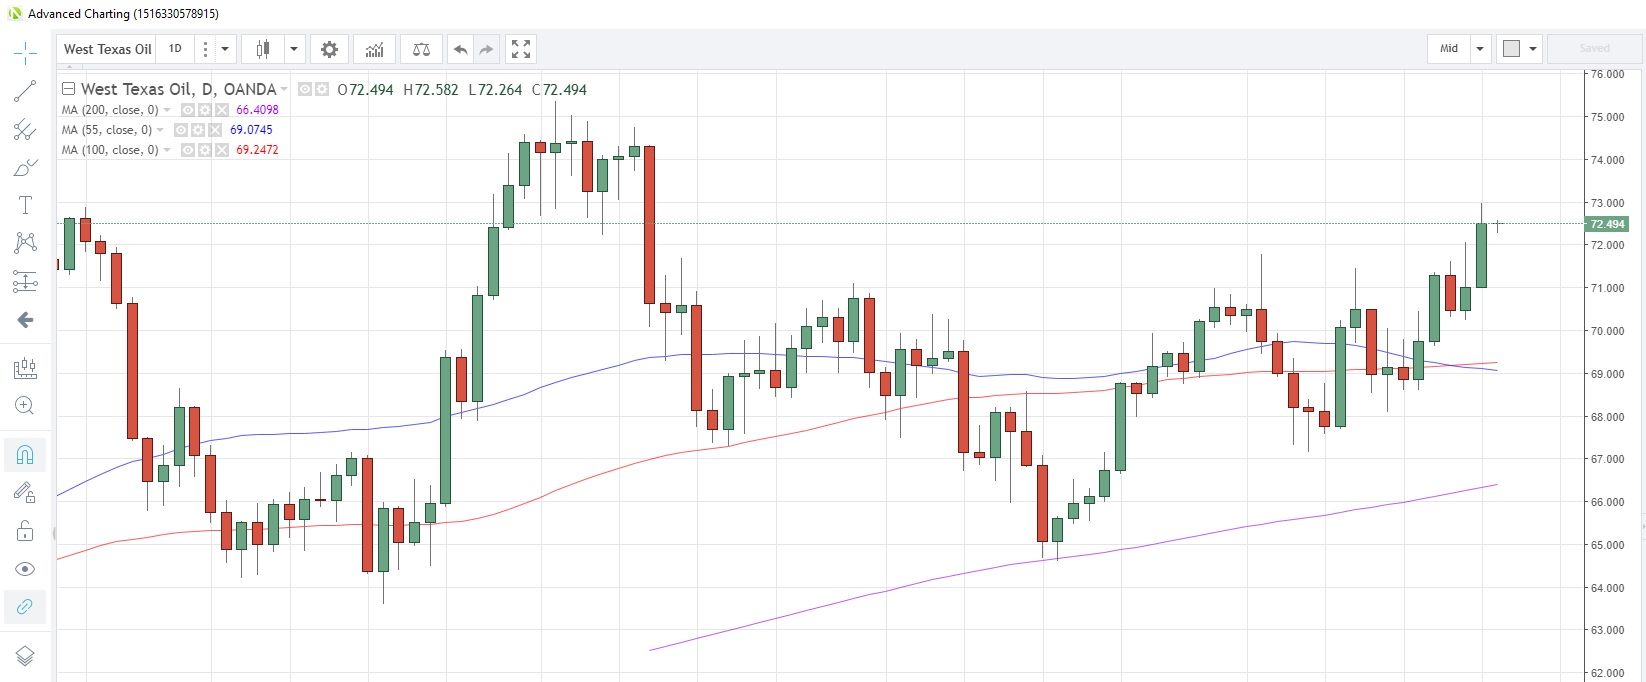
Source Oanda fxTrade
Agriculturals
SUGAR is trading at a four-week low, falling xxx% today to break a three-day rising streak. The commodity is now at 0.10404 after touching a low of 0.10258 earlier this morning.
News that Indian had delayed a Cabinet decision on exports to later this week implied a short-term increase in supply. Meanwhile, Australia’s trade minister has threatened to lodge a complaint against India unless it cuts its heavy subsidies paid to its cane farmers, which has caused a major glut in stocks and led to lower prices, which has hurt Australia’s $2 billion export sugar industry.
CORN has snapped a four-day rising streak as it fails to breach the 55-day moving average convincingly. The moving average is at 3.4827 and corn peaked at 3.486 yesterday. It is now trading at 3.457. Speculative non-commercial net positions are their most negative since January 23, as of September 18. China’s Customs Administration reported that the country’s corn imports were 13.5% lower than a year ago in August.
WHEAT is another commodity that is struggling to make headway above the 55-day moving average. Wheat is set for its first drop in six sessions as the moving average at 5.1144 acts as a barrier.
The European Commission reported that EU soft-wheat exports were down 29% on year for the season running from July 1 to Sep 23. Argentina’s grain ports will be at a standstill today as a national strikes comes into effect.
SOYBEANS likewise are being capped by the 55-day moving average and has held since August 21. The commodity is mow trading at 8.353 with the 55-day moving average at 8.482.
China has targeted soybean farmers in Iowa with an advertising supplement highlighting the “folly” of the US president. The story says points out how the trade dispute is forcing Chinese importers to turn to South America instead of the US for its soybean supplies. Iowa is one of the hardest hit states due to Trump’s trade policies with Iowa soybean exports suffering $30.8 million in tariffs and total exports up to $1 billion.
Content is for general information purposes only. It is not investment advice or a solution to buy or sell securities. Opinions are the authors; not necessarily that of OANDA Business Information & Services, Inc. or any of its affiliates, subsidiaries, officers or directors. If you would like to reproduce or redistribute any of the content found on MarketPulse, an award winning forex, commodities and global indices analysis and news site service produced by OANDA Business Information & Services, Inc., please access the RSS feed or contact us at info@marketpulse.com. Visit https://www.marketpulse.com/ to find out more about the beat of the global markets. © 2023 OANDA Business Information & Services Inc.

Andrew Robinson
Latest posts by Andrew Robinson (see all)
- RBA cuts rates on virus impact - 2 March 2020
- Commodities Weekly: Oil rises first time in eight days - 2 March 2020
- Daily Markets Broadcast 2020-03-03 - 2 March 2020