Oil prices are edging higher on supply concerns involving both Saudi Arabia and Iran while hot, dry weather across the northern hemisphere is having an effect on anticipated harvests in the agricultural sector and also increasing expected demand for energy as the world tries to keep cool. However, ongoing trade tariff wars continue to be a damper on rallies for some products.
Energy
OIL prices edged higher, with WTI rising to a near one-week high yesterday, after the Trump Administration confirmed that the first phase of new Iran sanctions will go into effect later today. In addition, OPEC sources suggested that Saudi Arabia’s supply had unexpectedly fallen in July.
Prices continue to hold above the 100-day moving average on a closing basis, which has held since June 19. The Brent/WTI spread has dipped marginally below the 4.0 mark this month. The weekly EIA crude inventory data is due tomorrow and is expected to show a drawdown of 1.17 million barrels, according to the latest survey of analysts, compared with an increase of 3.8 million barrels last week.
Brent/WTI Daily Chart

Source: Oanda fxTrade
An anticipated hot spell across Northeastern US in the coming weeks has built expectations of an increase in demand for NATURAL GAS for cooling purposes, and has helped propel prices to a near five-week high. There appears to be little reaction to news that China said it is considering imposing a 25% tariff on imports of US natural gas as part of its retaliation against the US’ proposed tariffs on $200 billion worth of Chinese imports.
Natural Gas inventories rose to 35 billion cubic feet in the week to July 27, according to EIA data released August 2. The commodity is currently trading at 2.875 after closing above the 55-day moving average yesterday, the first time since July 3.
Precious metals
GOLD continues to struggle near 18-month lows, just above the 1,200 level, as the US dollar reigns supreme. Speculative net long futures positions slid to 35,337 contracts in the week to July 31, according to CFTC data released Friday. That is the lowest net long position since January 2016. SPDR Gold Trust GLD, the world’s largest gold-backed exchange-traded fund, also said its holdings fell 0.78% to 788.7 tonnes on Monday from 794.90 tonnes on Friday, Reuter reports.
Gold has fallen another 1.6% this month, set for a fifth straight monthly decline and is down 11.8% from the peak in April.
SILVER continues to be capped by the 55-month moving average and is facing its third straight monthly decline. Speculators’ bullish positioning increased by 2,326 contracts in the week to July 31, according to the latest CFTC data. The gold/silver (Mint) ratio is currently sandwiched between the 55- and 100-day moving averages at 78.17 and 78.96, respectively.
Gold/Silver (Mint) Ratio Daily Chart
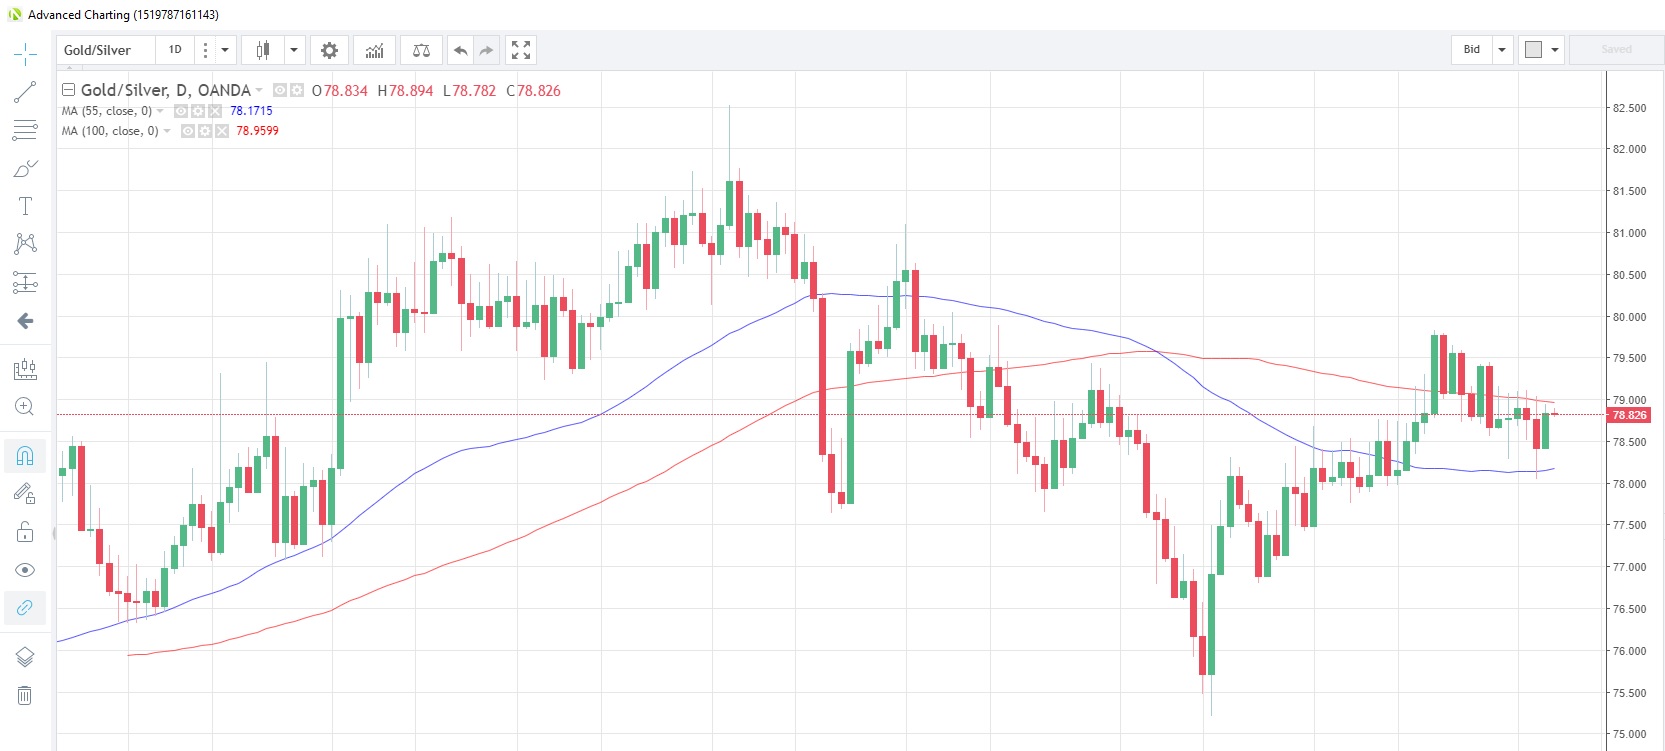
Source: Oanda fxTrade
PLATINUM has traded sideways so far this month with activity confined to 812-841 parameters. The downward-sloping 55-day moving average continues to be an upside barrier and has capped the upside since March 1. It’s currently trading near mid-range at 824.10.
PALLADIUM is currently retracing the rally seen late-July and currently at 907.96, holding just above the 50% retracement level of that July 19-25 up-move, which is at 901.24. Traders increased their net long speculative positions in the precious metal for the first time in four weeks in the week through July 31, according to CFTC data.
Base metals
COPPER is still being dogged by escalating trade wars amid a cloudy outlook for global growth. The industrial metal survived a test of the 55-month moving average last month and that technical level, currently at 2.6964, should continue to provide support. The July low of 2.65 would be the next support level. Speculative accounts reduced their net long positions by 1,143 contracts to 8,224, the least since the week of May 9, 2017.
The pending strike at BHP’s Escondida copper mine in Chile, the world’s largest, appears to have been averted as the company announced Monday it had formally requested government mediation with the union in its latest wage negotiations. The two parties have until August 13 to reach an agreement, with a possible extension for a further five days.
Agriculturals
SUGAR continues its rebound from three-year lows as dry weather in growing regions affects anticipated harvests. A recent report suggested sugar output from the EU could fall as much as 7.8% from a year ago due to this effect. Sugar is poised for is third consecutive up day after hitting an apparent near-term bottom of 0.10201 on August 2. It’s currently trading at 0.10814 with resistance seen at the 55-day moving average, currently at 0.1153.
SOYBEANS are perhaps one of the hardest hit commodities in the trade tariff wars since it was almost first on the list. The commodity staged a near 12% rally in July from near-term lows as analysts anticipate continued demand, despite China reportedly seeking alternative sources, including home-grown products. August has seen the commodity consolidating that move.
An example of this continued demand is seen in data released by the United States Department of Agriculture yesterday that showed a cargo of soybean left US shores for China, despite the introduction of China tariffs. However, Xinhua News Agency reported Sunday that China could reduce imports of US soybeans by as much as 10 million tons as it seeks alternative sourcing and alternative products.
The global hot spells that have fueled Natural Gas demand have also caused droughts in WHEAT-growing regions, wreaking havoc with global harvests, which are seen shrinking to a three-year low. Wheat prices hit a three-year high earlier this month and are currently testing the 100-month moving average resistance, which is at 5.7657. The commodity has not closed above this moving average since April 2014.
Wheat CFD Monthly Chart
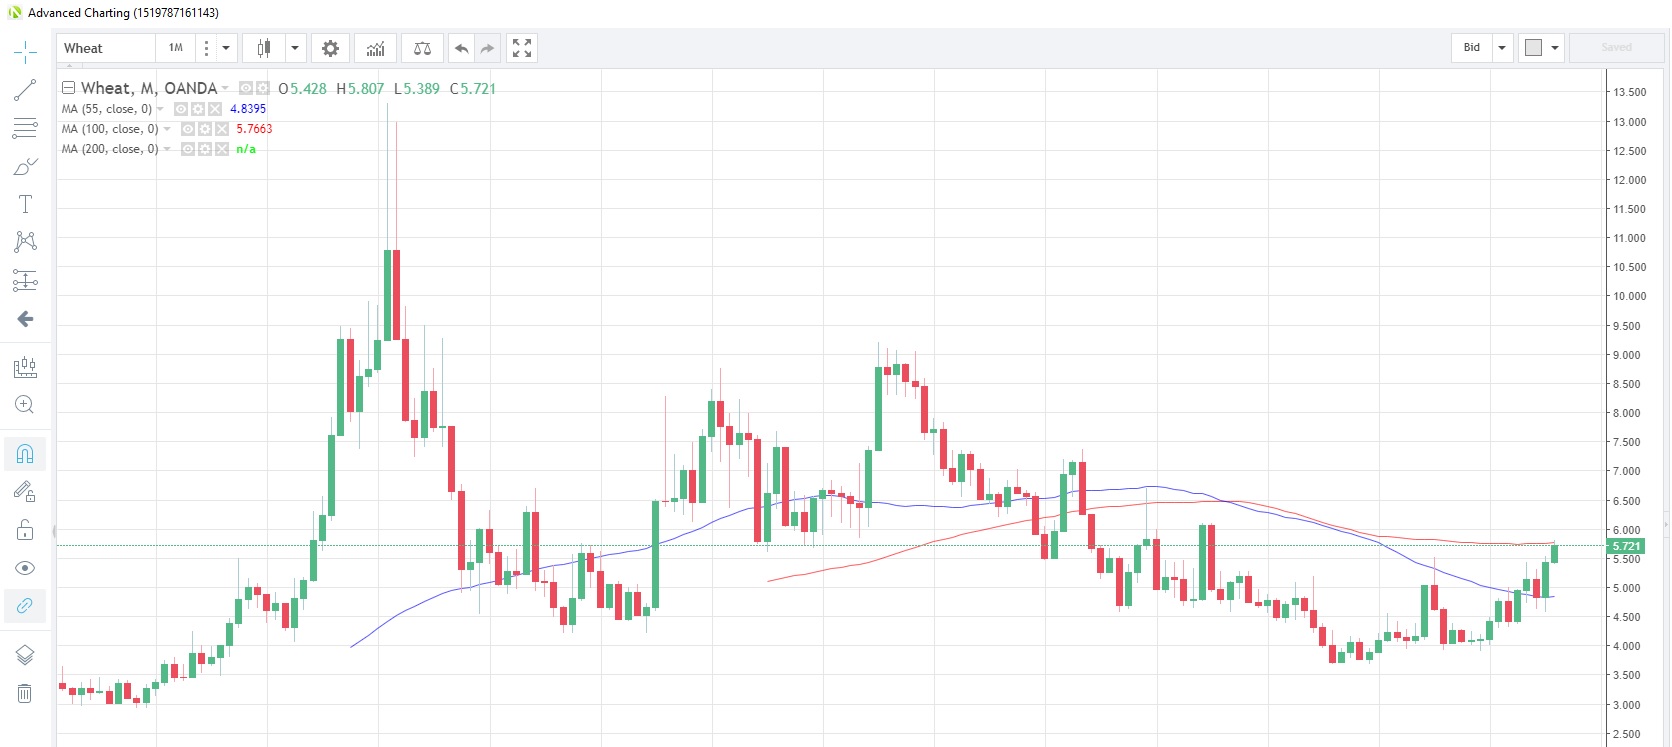
Source: Oanda fxTrade
Content is for general information purposes only. It is not investment advice or a solution to buy or sell securities. Opinions are the authors; not necessarily that of OANDA Business Information & Services, Inc. or any of its affiliates, subsidiaries, officers or directors. If you would like to reproduce or redistribute any of the content found on MarketPulse, an award winning forex, commodities and global indices analysis and news site service produced by OANDA Business Information & Services, Inc., please access the RSS feed or contact us at info@marketpulse.com. Visit https://www.marketpulse.com/ to find out more about the beat of the global markets. © 2023 OANDA Business Information & Services Inc.

Andrew Robinson
Latest posts by Andrew Robinson (see all)
- RBA cuts rates on virus impact - 2 March 2020
- Commodities Weekly: Oil rises first time in eight days - 2 March 2020
- Daily Markets Broadcast 2020-03-03 - 2 March 2020