Dollar weakness and soft US economic data has helped propel Gold back towards the top of its trading range in the last couple of days and that resistance level could now come under serious threat.
Yesterday’s weak retail sales figures for April had a particularly strong impact on the yellow metal, driving it almost 2% higher on the day. If that momentum could be sustained, it could break above the $1,225 resistance that has capped moves over the last few months, prompting a move towards $1,275.
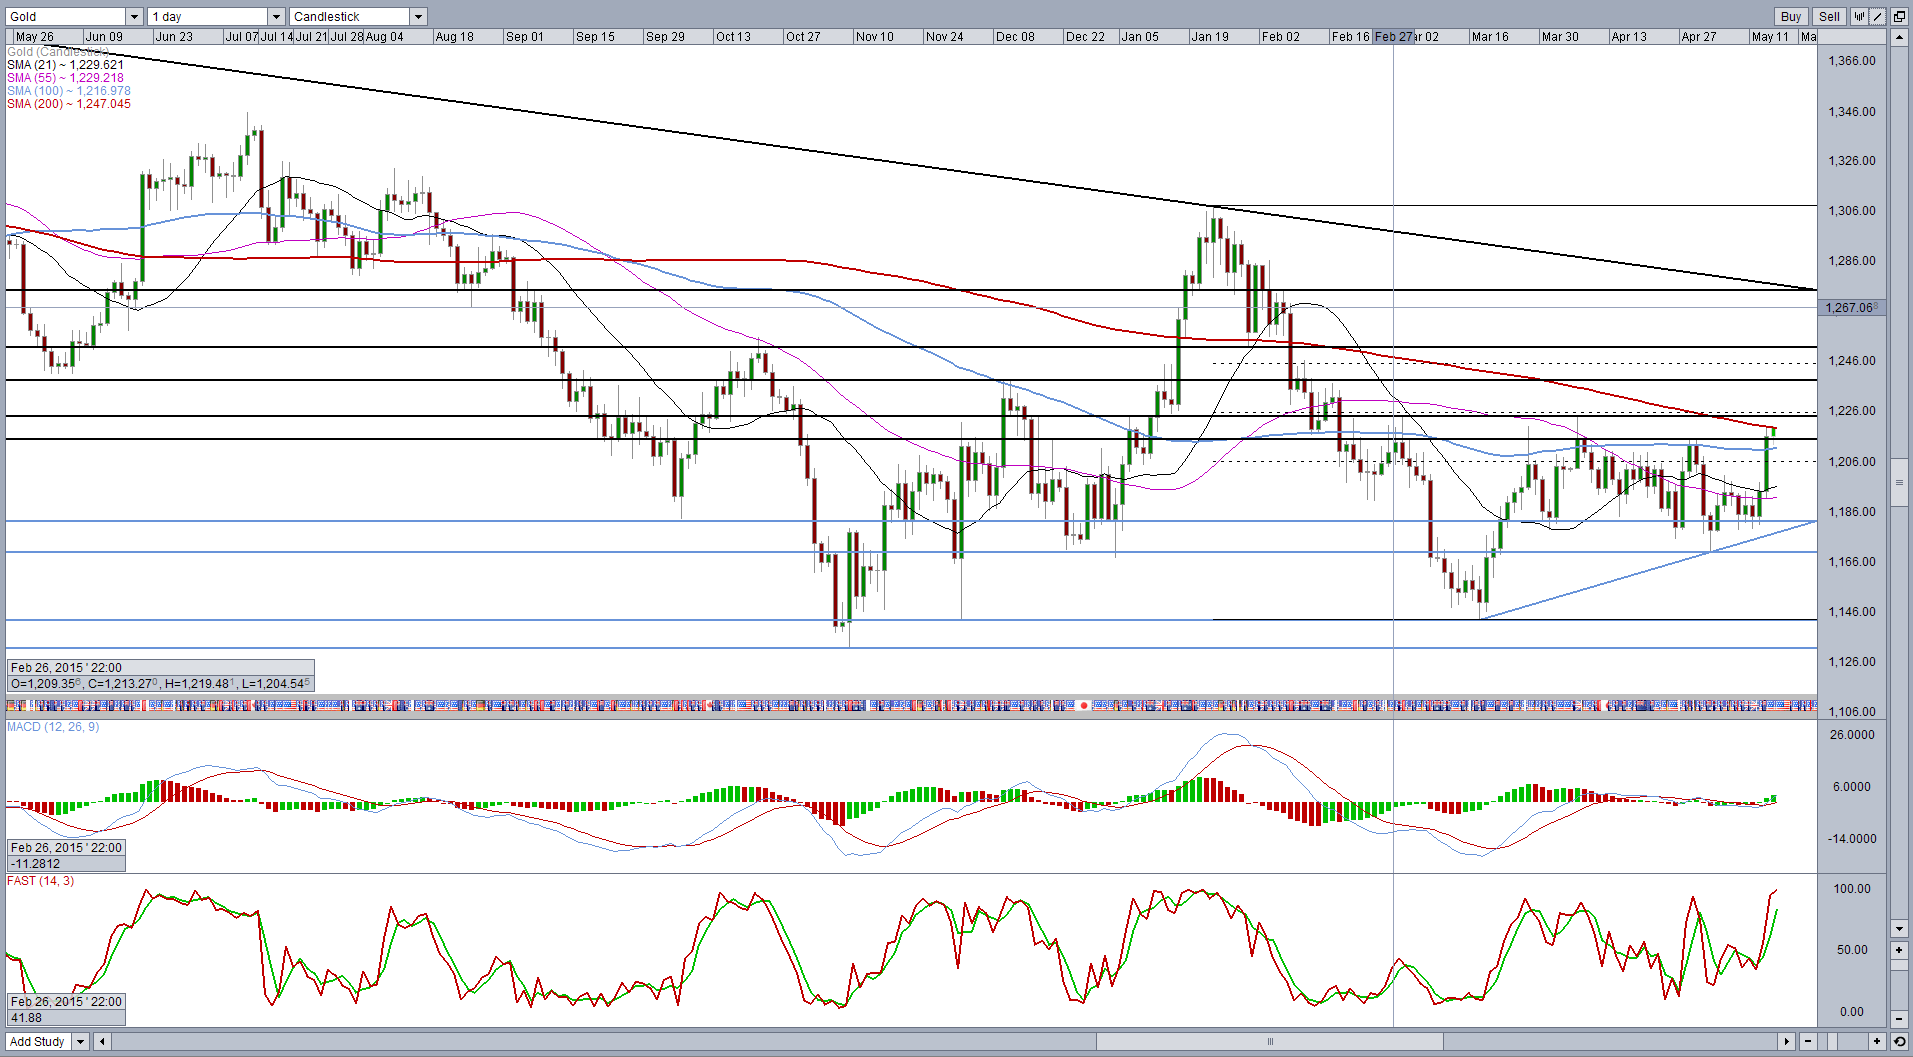
While it may face resistance around $1,225, I’m not convinced that it will be enough to stop the bulls forcing their way through. The move is gaining momentum even as we approach this level. The 200-day simple moving average appears to be offering further resistance around $1,220 but even this may prove temporary.
At the end of the day, this is broadly a sideways trending market and under these conditions, moving averages are less reliable support and resistance levels. Any barrier they do provide can quite often be temporary, unlike in an upward or downward trending market.
Adding to the resistance around $1,225 is the 50 fib level – 22 January highs to 17 March lows. This adds to the number of stops that could be found just above this level and therefore any break could be quite aggressive.
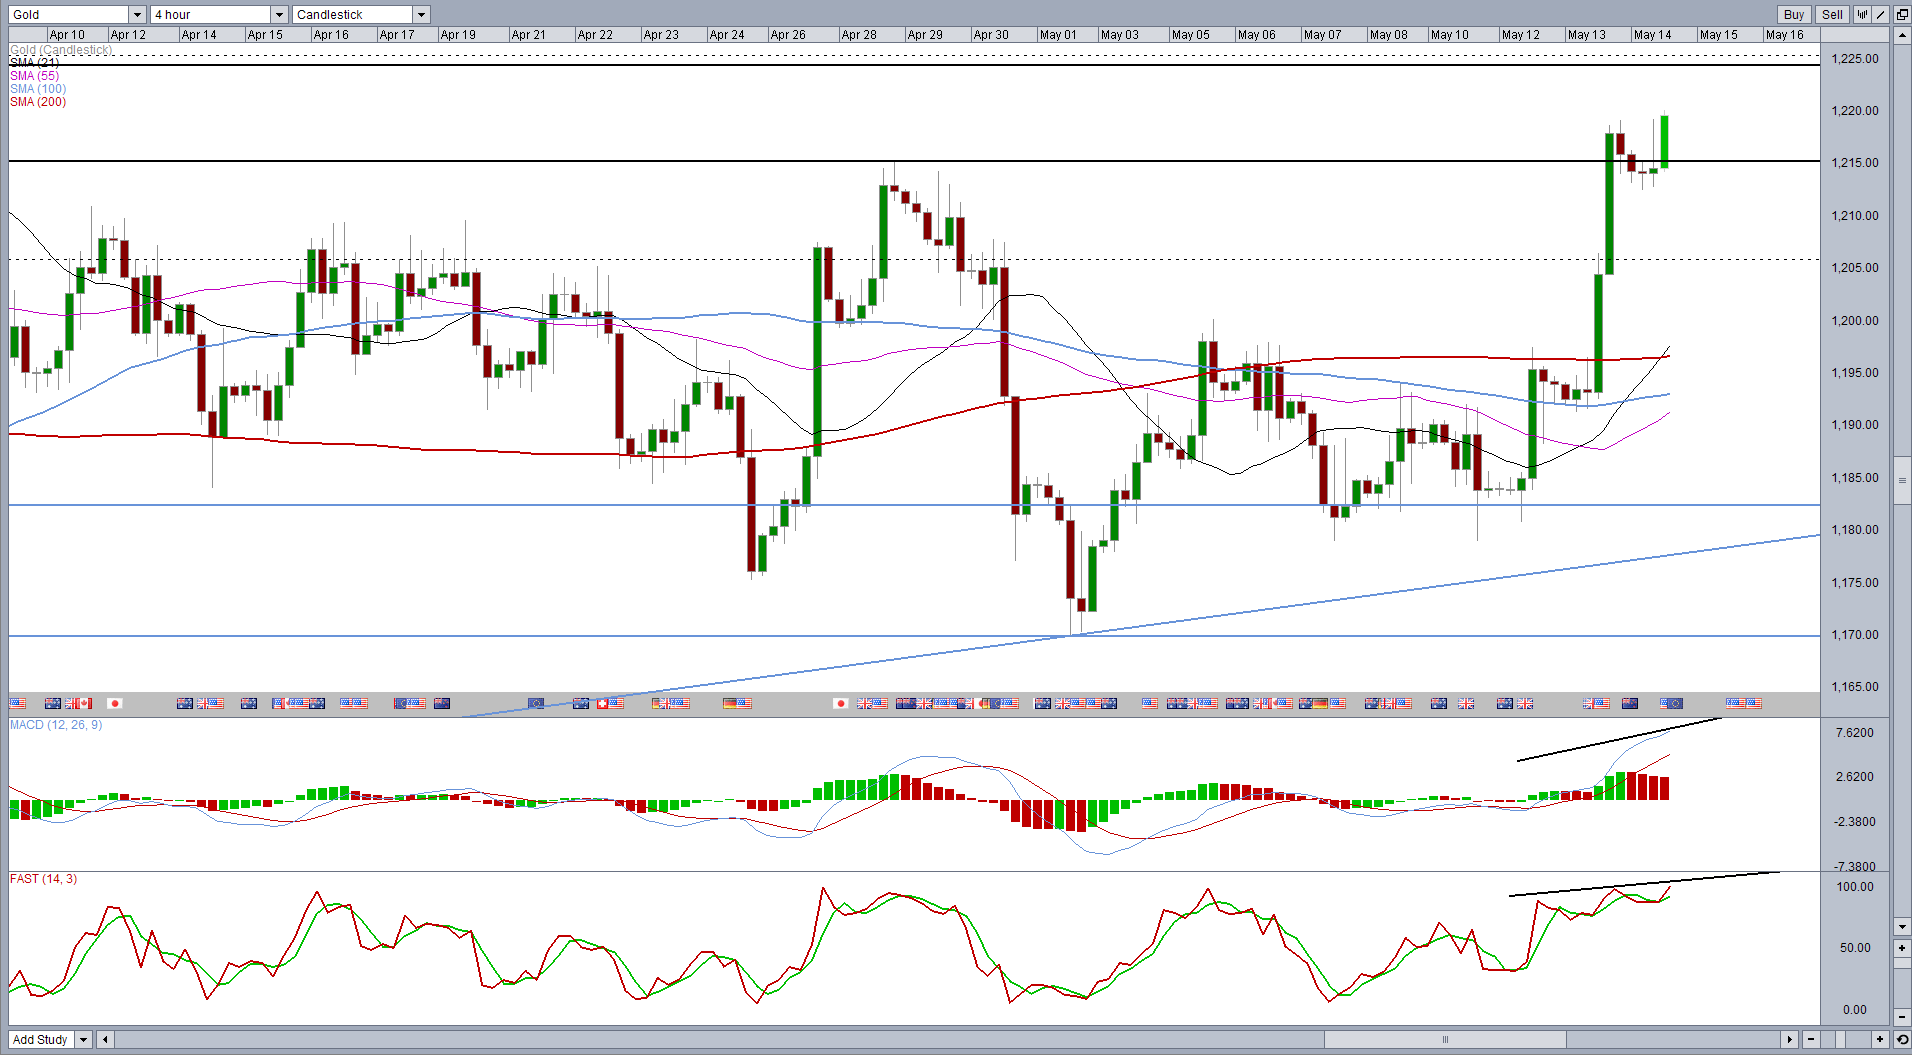
Gold has looked more bullish ever since it made a new high at the beginning of the month which has led to the formation of an ascending triangle. We don’t always see an immediate break higher following this, especially as the ascending trend line hasn’t been confirmed with a third touch but I think that retail sales figure and the impact it had on interest rate expectations may be enough on this occasion.
If we do see a break above this level, the pair may run into further resistance around $1,240 which has previously been a good level of support and resistance but again, I would expect and resistance to be temporary as the break of $1,225 would be much more significant. Above here, $1,250 and $1,270 may provide further resistance along the way.
Even with all this in mind, I will be closely monitoring the one and four hour charts for any signs that momentum is dropping around $1,225 and reversal setups are forming and this would suggest the three month consolidation is going to continue for a little longer yet.
Content is for general information purposes only. It is not investment advice or a solution to buy or sell securities. Opinions are the authors; not necessarily that of OANDA Business Information & Services, Inc. or any of its affiliates, subsidiaries, officers or directors. If you would like to reproduce or redistribute any of the content found on MarketPulse, an award winning forex, commodities and global indices analysis and news site service produced by OANDA Business Information & Services, Inc., please access the RSS feed or contact us at info@marketpulse.com. Visit https://www.marketpulse.com/ to find out more about the beat of the global markets. © 2023 OANDA Business Information & Services Inc.

Former Craig
Latest posts by Former Craig (see all)
- Market Insights Podcast – US GDP, RBNZ holds, bitcoin soars - 28 February 2024
- Market Insights Podcast – Nvidia earnings, record highs for stocks - 23 February 2024
- EUR/USD – A bullish breakout or just further consolidation? - 22 February 2024