So near yet so far? USD/JPY reached a week high of 99.88 on Monday but pulled back significantly due to risk appetite vaporizing. Stocks headed lower yesterday amidst mixed US data and corporate earnings, while Today continued the downtrend with China HSBC Flash Manufacturing PMI coming in much lower than expected. Europe session opened with more depressing news as German PMI Manufacturing came in at 47.9 vs 49.0 expected. Service sector PMI came in at 49.2 vs 51.0, clocking in the first shrinkage in service sector since November 2012. This news shook risk appetite further, driving USD/JPY towards 98.5 after 99.0 has been broken earlier.
Hourly Chart
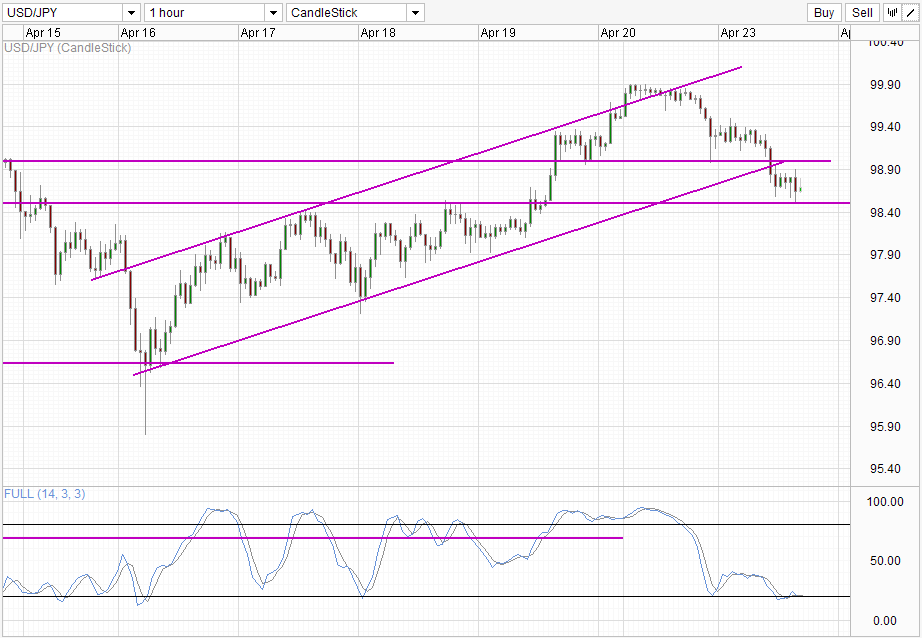
98.6 provides the last support for current bullish attempt. A break below this level will open up 96.6 once again. Stochastic readings is mixed – on one hand readings is appearing to form a trough just around the Oversold region, however readings are not actively pointing higher, suggesting that a bull cycle may not be yet in place. Perhaps we could see firmer sign of a bull cycle from Stochastic should price test 98.5 once more, this would help to open up 99.0 again, with a break above the level opening up 100.0 for bulls to get one more shot.
Daily Chart
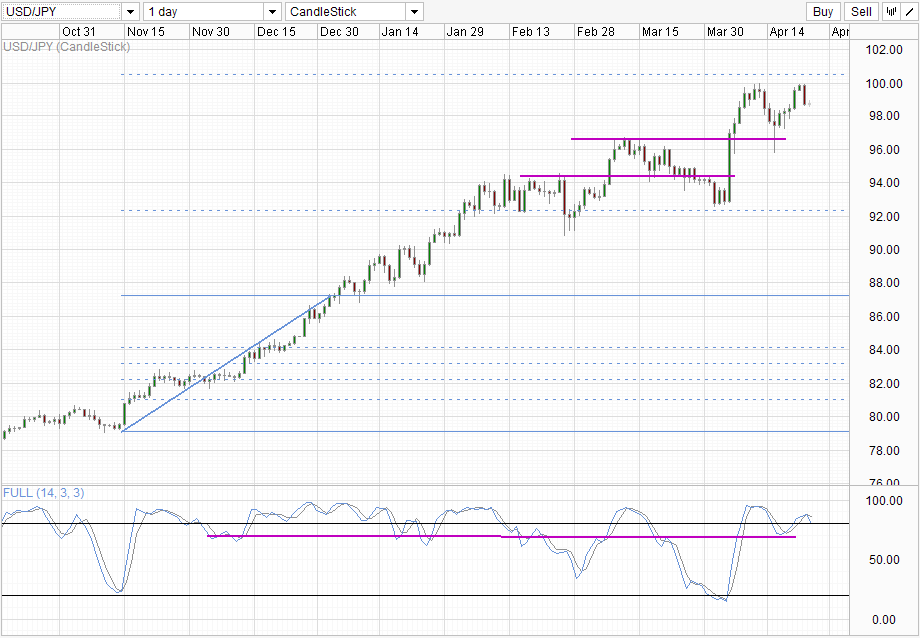
Daily Chart is becoming less bullish. If price continue current trajectory and fall below 96.6, the case for a double top pattern emerges, which may open up a scenario of price retracing all of the gains since Nov especially if 92.3 and confluence of 161.8% Fib extension is broken. Stochastic reading is showing similar double top pattern, but the height of current peak is clearly below the previous, giving bulls hope that this bear cycle signal can be filtered out due to the divergence. There could still be a chance where readings fall below 80.0 only to find support along the purple trendline, which may be in line with actual price finding support around 98.5, which will allow for a retest of 100.0 as explained in the hourly chart above.
Open Position Ratios
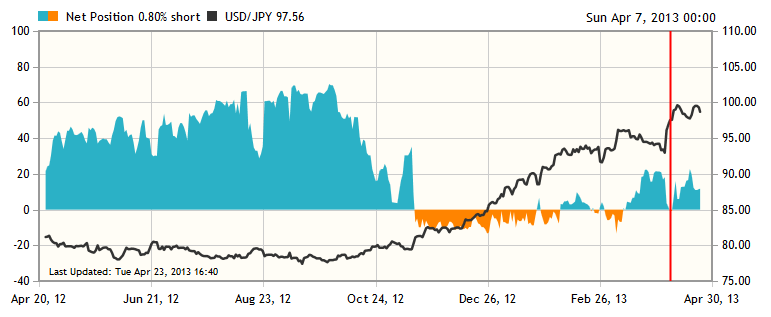
Interestingly, retail clients of OANDA remain net long in Yen despite recent rally. Open Position Ratios tend to be a contraion indicator as evident by the falling long positions when USD/JPY is rising. Since early 8th April (demarcated by red line) , long ratios have increased significantly with price maintaining similar levels since. Is this a sign that correction will happen soon?
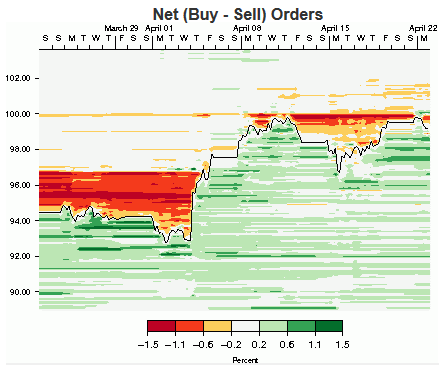
Looking at the pending orders, we see that the amount of sell orders around 100.0 continue to remain strong. However, bulls should be glad that there is the emergence of buy orders slightly above 100.0 now. It seems that market believes in the scenario of a breakout. Large pockets of buy orders can also be seen around 98.5 region, echoing technical analysis above with regards to 98.5 support.
Fundamentally, USD/JPY has detached itself from economic fundamentals from Japan long ago. As such, analysis of current market sentiment (such as the 2 charts above) may be a better indication of where USD/JPY is headed. With that being said, the odds of USD/JPY breaking 100.0 right now does not look so hot right now, but we are far from seeing a capitulation of bullish pressure right now. This would actually mean that USD/JPY may continue to trade sideways before a huge market moving news sweep price by storm. BOJ says they are done for now, Bernanke, it is your turn now.
More Links:
USD/SGD – Lowest Inflation since Oct as price breach 1.24
NZD/USD Technicals – Finding Support on 0.838
AUD/USD – 1 Month Low with Slower Chinese Manufacturing PMI
This article is for general information purposes only. It is not investment advice or a solution to buy or sell securities. Opinions are the authors; not necessarily that of OANDA Corporation or any of its affiliates, subsidiaries, officers or directors. Leveraged trading is high risk and not suitable for all. You could lose all of your deposited funds.

Mingze Wu
Latest posts by Mingze Wu (see all)
- European Bourses Not Enjoying Bullish Winds From US Stocks - 17 April 2014
- More Aggressive Stimulus Possible Despite Premier Li’s Denial - 17 April 2014
- China March FDI -1.5% Y/Y vs +2.05% expected. First decline in more than a year. - 16 April 2014