- In the past five days, the year-to-date laggard Dow Jones Industrial Average (DJIA) has played a positive catch-up.
- On a rolling 5-day performance basis, the DJIA has outperformed with a gain of +1.10% over the Nasdaq 100’s loss of -0.70% due to recent softness seen in the share price of Nvidia.
- Watch the key short-term support of 38,930.
This is a follow-up analysis of our prior report, “US DJIA Technical: Uptrend intact with looming outperformance over Nasdaq 100” published on 3 January 2024. Click here for a recap.
On a year-to-date performance basis as of 13 March 2024, the Nasdaq 100 has managed to record a gain of 8.3% that surpassed the return of the Dow Jones Industrial Average of +3.50%.
Interestingly, in the past five days (5-day rolling basis as of 13 March), the laggard Dow Jones Industrial Average has started to play a catch-with with a return of +1.10% that overtook the Nasdaq 100’s loss of -0.70%.
The primary attribution to the current short-term outperformance of the Dow Jones Industrial Average over the Nasdaq 100 has been the lacklustre performance of the Artificial Intelligence (AI) theme play leader, Nvidia (third largest component market cap weightage stock in Nasdaq 100) where its share price has shed -5.6% over the same period.
Potential major bullish basing condition in ratio chart of DJIA/NDX
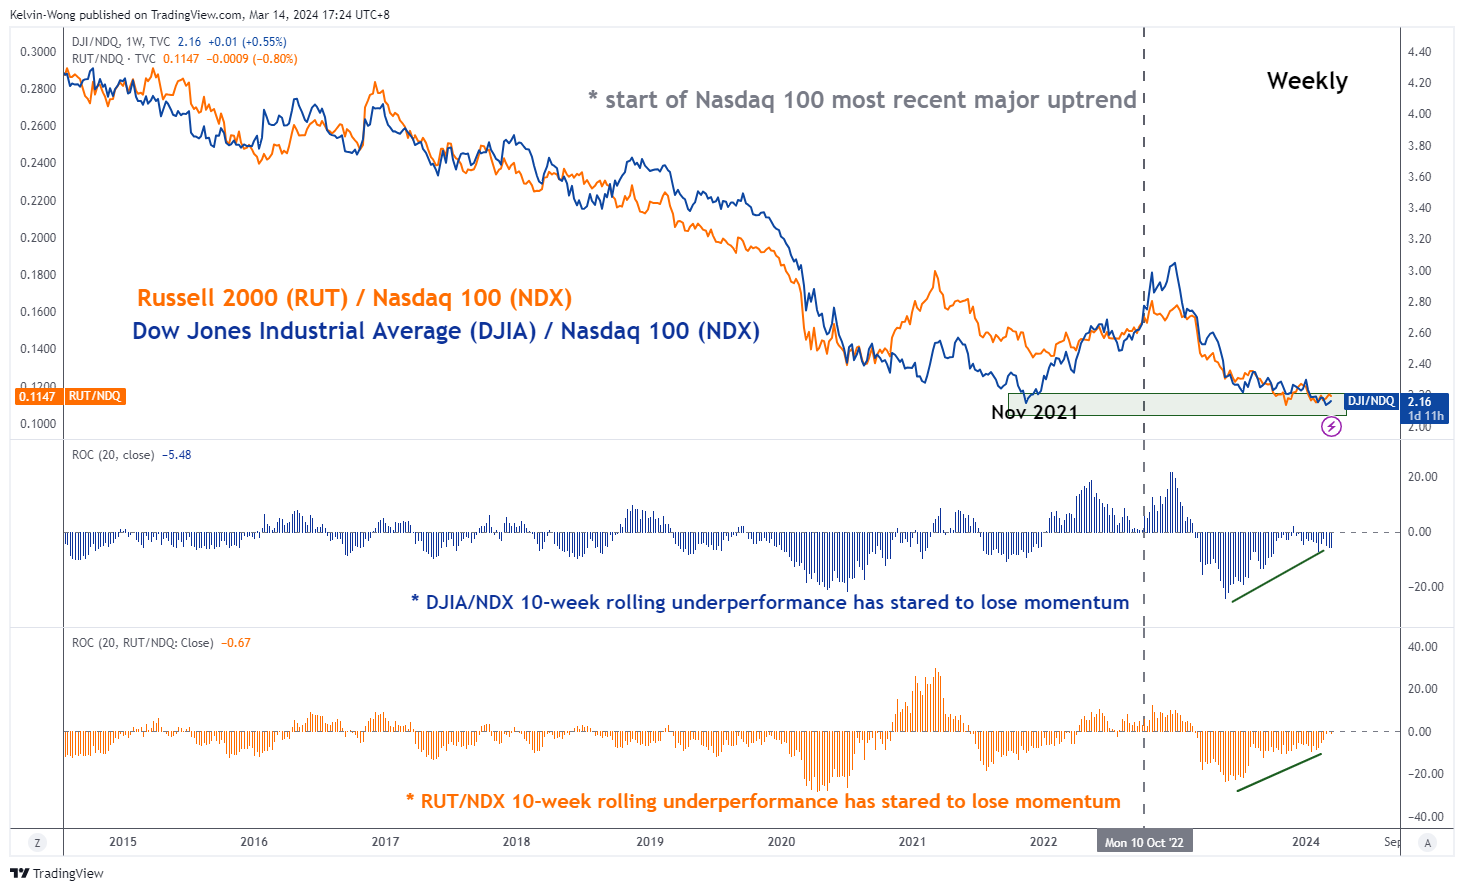
Fig 1: Ratio charts of DJIA & Russell 200 over Nasdaq 100 as of 14 Mar 2024 (Source: TradingView, click to enlarge chart)
The ratio chart of the Dow Jones Industrial Average (DJIA) over the Nasdaq 100 has started to form a potential major basing formation by not breaking below its prior significant November 2021 swing low (see Fig 1).
Also, its 10-week rolling underperformance measured by the ratio’s rate of change has continued to display a bullish divergence condition which suggests a potential looming major outperformance of DJIA over the Nasdaq 100.
Price actions cleared above 20-day moving average
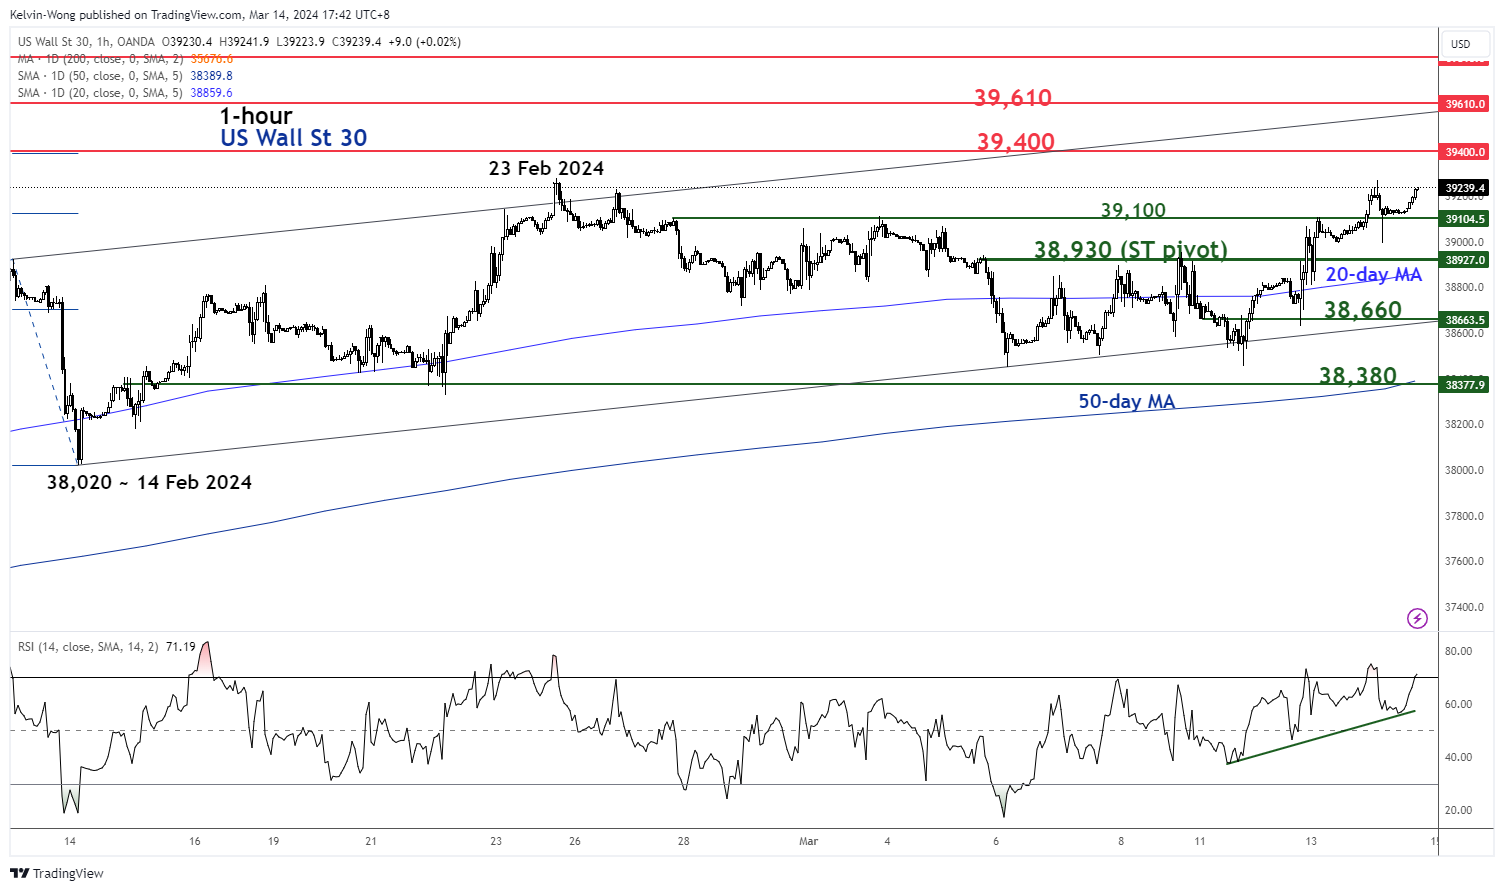
Fig 2: US Wall St 30 short-term trend as of 14 Mar 2024 (Source: TradingView, click to enlarge chart)
Yesterday, 13 March’s price actions movement of the US Wall St 30 Index (a proxy of the Dow Jones Industrial Average futures) staged a bullish breakout from its prior choppy minor range configuration in place since 23 February (see Fig 2).
In addition, the Index has also surpassed the 20-day moving average which suggests the potential revival of bullish momentum at least in the near-term horizon.
If the 38,930 short-term pivotal support holds, the Index may continue to shape “higher highs” for the next intermediate resistances to come in at 39,400 and 39,610 (also the upper boundary of the minor ascending channel from 14 February 2024 low).
On the flip side, a break below 38,930 negates the bullish tone for another round of choppy minor corrective decline that may expose the next intermediate supports at 38,660 and 38,380 (also the upward-sloping 50-day moving average).
Content is for general information purposes only. It is not investment advice or a solution to buy or sell securities. Opinions are the authors; not necessarily that of OANDA Business Information & Services, Inc. or any of its affiliates, subsidiaries, officers or directors. If you would like to reproduce or redistribute any of the content found on MarketPulse, an award winning forex, commodities and global indices analysis and news site service produced by OANDA Business Information & Services, Inc., please access the RSS feed or contact us at info@marketpulse.com. Visit https://www.marketpulse.com/ to find out more about the beat of the global markets. © 2023 OANDA Business Information & Services Inc.

Kelvin Wong
Passionate about connecting the dots in the financial markets and sharing perspectives around trading and investment, Kelvin Wong is an expert in using a unique combination of fundamental and technical analyses, specializing in Elliott Wave and fund flow positioning, to pinpoint key reversal levels in the financial markets.
In addition, over the last ten years, Kelvin has conducted numerous market outlook and trading-related seminars, as well as technical analysis training courses, for thousands of retail traders.
Latest posts by Kelvin Wong (see all)
- Gold Technical: The recent sell-off may have reached a potential bullish reversal level at US$2,353 - 26 July 2024
- SPX 500: Further weakness may trigger a medium-term global risk-off event - 25 July 2024
- Nasdaq 100: Potential bullish reversal looms ahead of Alphabet and Tesla earnings results - 23 July 2024