- Nikkei 225 has hit a 33-year high with a 2023 YTD return of +29%.
- Its 3-month up move has reached overstretched condition, more than two standard deviations above its 20-day moving average for three consecutive days.
- At the risk of a corrective pull-back with short-term bullish momentum dissipating.
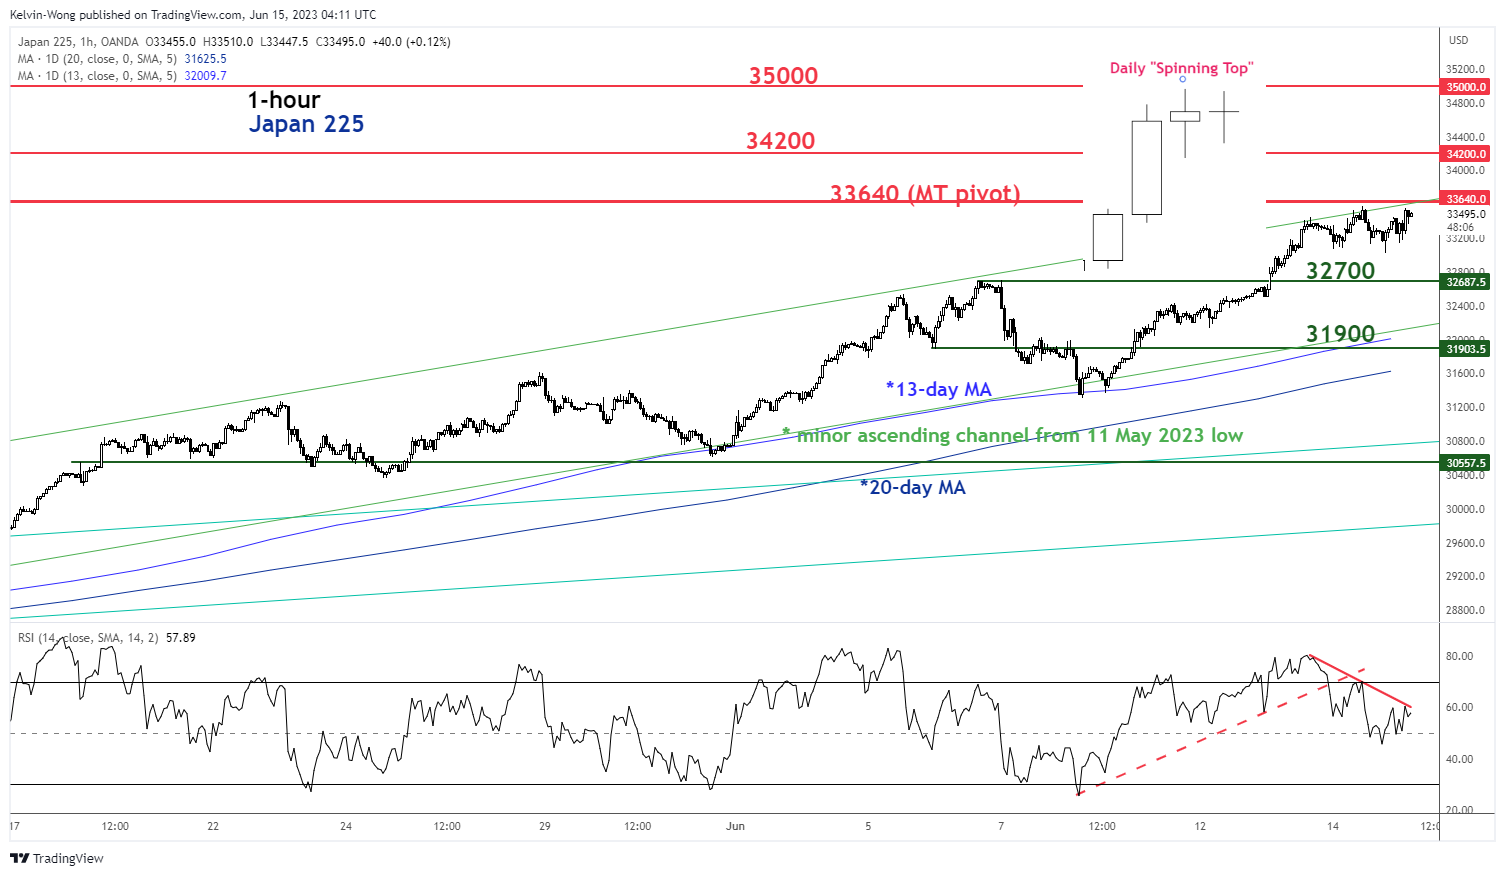
Fig 1: Japan 225 short-term trend as of 15 Jun 2023 (Source: TradingView, click to enlarge chart)
Since its 16 March 2023 low, the Japanese benchmark cash stock index, Nikkei 225 has staged a magnificent rally of 26.7% based on the current, 15 June intraday level of 33,720 at this time of the writing, a 33-year high and notched a 2023 year-to-date return of +29%, one of the top performing major stock indices (second to the US Nasdaq 100 at 37% YTD).
Rally hit overstretched condition
The 3-month of medium-term up move has reached an overstretched condition where its price actions have traded beyond two standard deviations above its 20-day moving average for three consecutive days.
The Japan 225 (a proxy of the Nikkei 225 futures) has almost reached a key short-term resistance of 33,640, defined by the upper boundary of a minor ascending channel in place since the 11 May 20023 low and a Fibonacci extension cluster.
Exhaustion elements surfaced, at risk of minor corrective decline
In addition, several bullish exhaustion elements have emerged, and the daily price action of 14 June 2023 has formed a “Spinning Top” Japanese candlestick pattern. In the shorter-term frame, the 1-hour RSI oscillator has formed a bearish divergence signal after it reached a 5-day high overbought level of 80.36 on 13 June 2023.
Watch the 33,640 key short-term pivotal resistance with near-term support at 32,700 and a break below it exposes the next support at 31,900 (the 13-day moving average & the lower boundary of the minor ascending channel). On the flip side, a clearance above 33,640 negates the bearish tone to see the next resistances coming in at 34,200 and 35,000.
Content is for general information purposes only. It is not investment advice or a solution to buy or sell securities. Opinions are the authors; not necessarily that of OANDA Business Information & Services, Inc. or any of its affiliates, subsidiaries, officers or directors. If you would like to reproduce or redistribute any of the content found on MarketPulse, an award winning forex, commodities and global indices analysis and news site service produced by OANDA Business Information & Services, Inc., please access the RSS feed or contact us at info@marketpulse.com. Visit https://www.marketpulse.com/ to find out more about the beat of the global markets. © 2023 OANDA Business Information & Services Inc.