- The prior four days of the rally have reached an extreme overbought condition.
- Odds have increased for a minor pull-back scenario reinforced by the latest reading from the 4-hour RSI momentum indicator.
- Watch the 32,760 key short-term pivotal resistance with an immediate support zone at 32,120/31,620.
This is a follow-up analysis of our prior report, “Nikkei 225: Short-term positive momentum emerged ahead of BoJ” published on 30 October 2023. Click here for a recap.
In the past week, the Japan 225 Index (a proxy for the Nikkei 225 futures) has indeed staged the expected bullish reversal after a retest close to its 200-day moving average and 30,490/320 medium-term pivotal support zone.
It rallied by +6.85% to print an intraday high of 32,823 on 3 November and notched its best weekly return since March 2022.
Overstretched rally
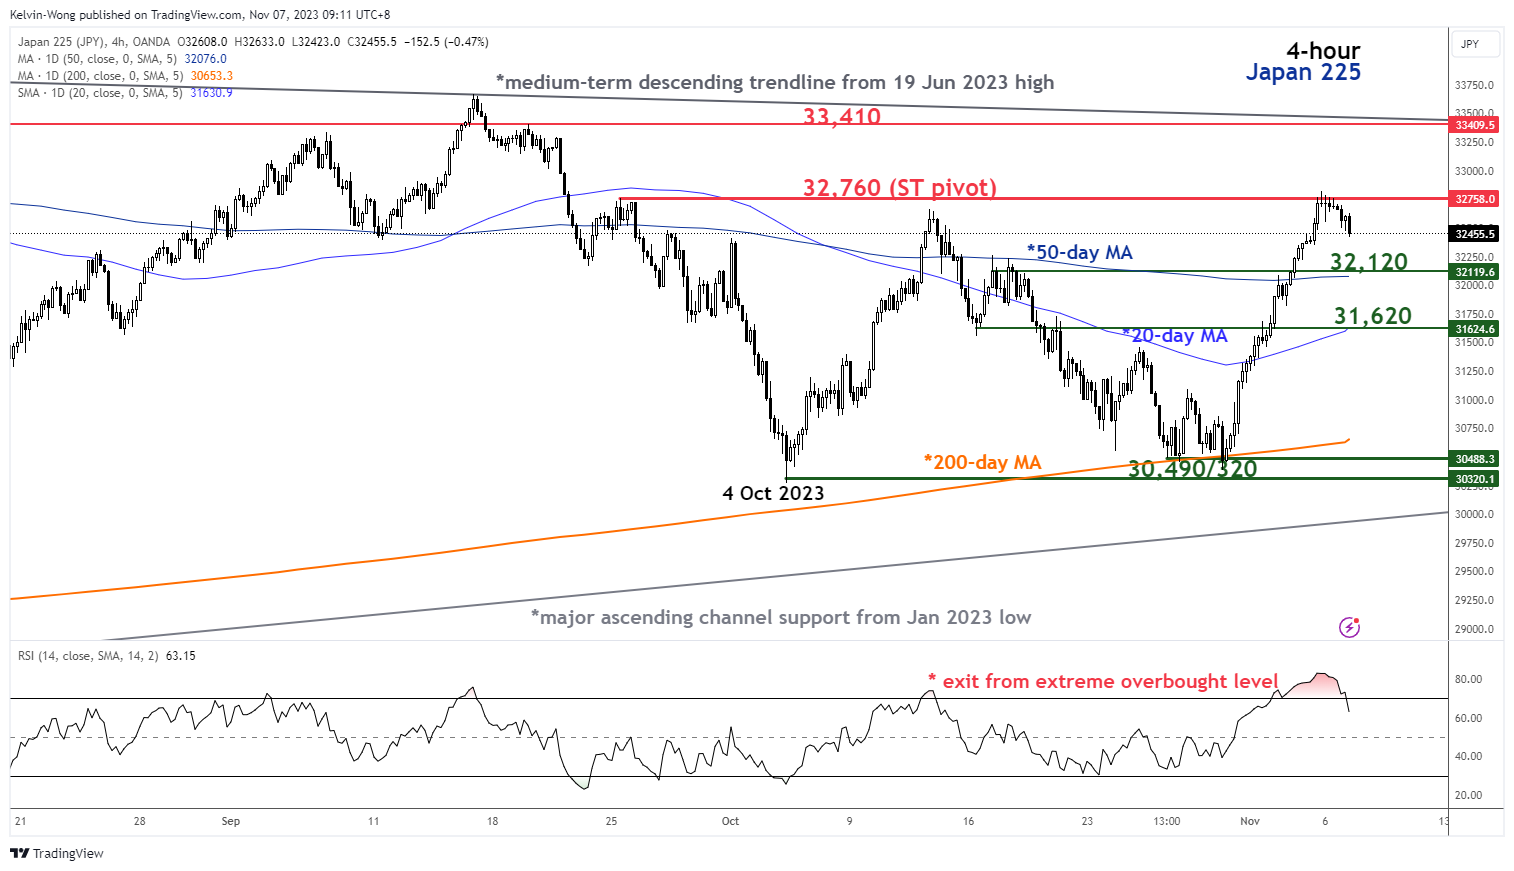
Fig 1: Japan 225 minor short-term trend as of 7 Nov 2023 (Source: TradingView, click to enlarge chart)
The past four days of bullish impulsive moves have now reached an extreme overbought condition as depicted by the 4-hour RSI momentum indicator with a reading of 82.84 printed yesterday, 6 November, its highest level since 17 May 2023.
Right now, the RSI indicator has just exited from its overbought which increases the odds of a minor pull-back towards the 20 and 50-day moving average region.
Watch the 32,760 key short-term pivotal resistance
If the 32,760 pivotal resistance (also the minor swing highs area of 25 September/12 October 2023) is not surpassed to the upside, the price actions of the Japan 225 Index may undergo a minor corrective pull-back towards the immediate support zone of 32,120/31,620 (50% Fibonacci retracement of the recent swift up move from 30 October low to 4 November 2023 high & the 20-day moving average) before a potential new bullish impulsive up move sequence unf0lds.
However, a clearance above 32,760 opens up scope to see the next intermediate resistance coming in at 33,410 in the first step (the medium-term descending trendline in place since the 19 June 2023 high).
Content is for general information purposes only. It is not investment advice or a solution to buy or sell securities. Opinions are the authors; not necessarily that of OANDA Business Information & Services, Inc. or any of its affiliates, subsidiaries, officers or directors. If you would like to reproduce or redistribute any of the content found on MarketPulse, an award winning forex, commodities and global indices analysis and news site service produced by OANDA Business Information & Services, Inc., please access the RSS feed or contact us at info@marketpulse.com. Visit https://www.marketpulse.com/ to find out more about the beat of the global markets. © 2023 OANDA Business Information & Services Inc.