- Last week, Nasdaq 100 underperformed against the other major US stock indices.
- Nasdaq 100 failed to have a weekly close above 15,690 key medium-term resistance and ended with a weekly bearish “Shooting Star” candlestick pattern.
- Key near-term support will be at 15,270 (20-day moving average).
Last week, the year-to-date highly flying technology-concentrated Nasdaq 100 underperformed with a weekly loss of -0.90% versus weekly gains seen in other major US stock indices; S&P 500 (+0.69%), Dow Jones Industrial Average (+2.08%), and Russell 2000 (+1.51%).
The underperformance of the Nasdaq 100 has been caused by the “Magnificent Seven” cohort with weekly losses seen in Telsa (-7.59%), Alphabet (-4.30%), Meta (-4.73%), Amazon (-3.48%), and Nvidia (-2.55%).
Nasdaq 100 failed to have a weekly close above 15,690 key medium-term resistance
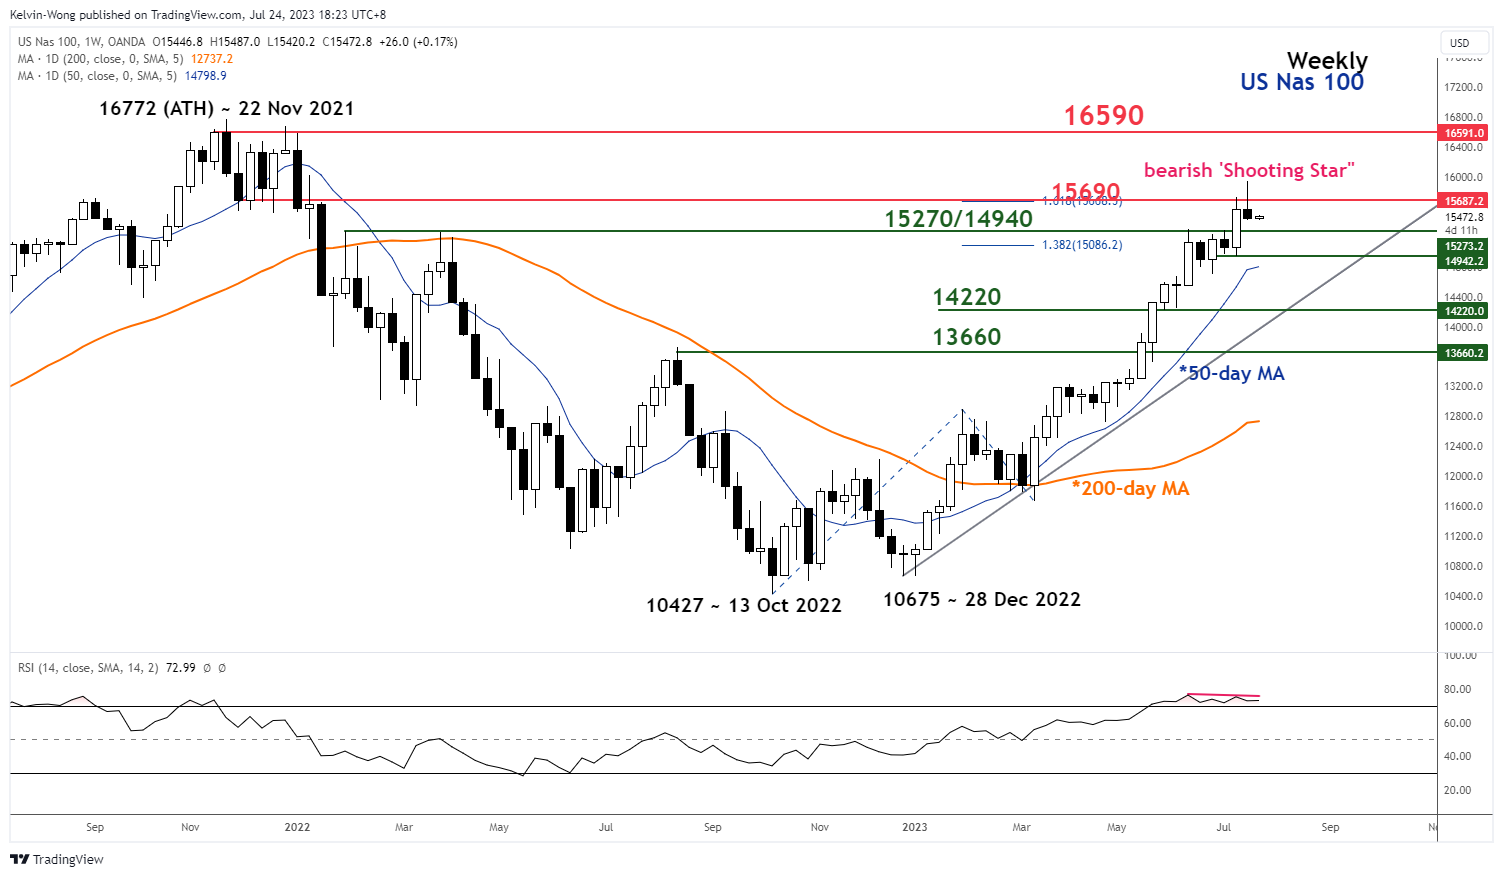
Fig 1: Nasdaq 100 major trend as of 24 Jul 2023 (Source: TradingView, click to enlarge chart)
The initial price actions of the US Nas 100 Index (a proxy for the Nasdaq 100 futures) breached above the 15,690 key medium-term resistance in the first half of last week but reintegrated below it last Thursday, 20 July, and failed to have a weekly close above 15,690.
In addition, it has formed a weekly bearish “Shooting Star” candlestick pattern which indicates that the bullish sentiment of the medium-term up move in place since the March 2023 low is likely to be exhausted (see weekly chart).
Also, the weekly RSI oscillator has traced out a bearish divergence signal at its overbought region which suggests medium-term and major upside momentum has started to wane. These observations increase the risks of a potential multi-week corrective decline below 15,690.
Price actions evolved into a minor downtrend phase
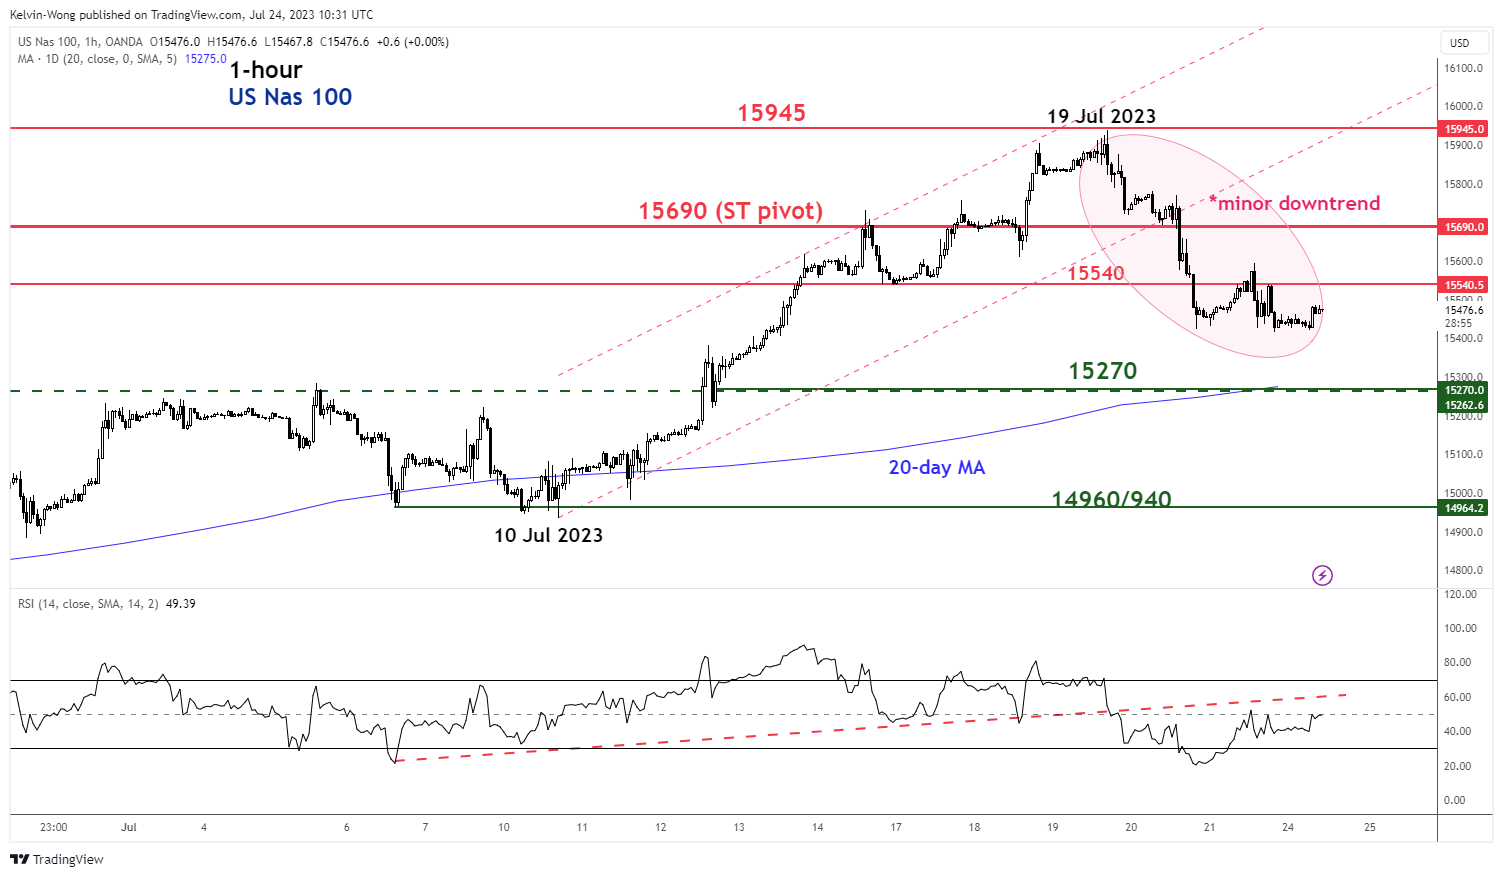
Fig 2: Nasdaq 100 minor short-term trend as of 24 Jul 2023 (Source: TradingView, click to enlarge chart)
Since its 19 July 2023 intraday high of 15,937, the price actions of the Index have traced out a series of “lower highs and lower lows” which indicate a minor downtrend phase is in progress.
Watch the 15,690 key pivotal resistance to maintain the minor downtrend with the next near-term support coming in at 15,270 (also the 20-day moving average).
However, a clearance above 15,690 negates the bearish tone to see the next resistance at 15,945.
Content is for general information purposes only. It is not investment advice or a solution to buy or sell securities. Opinions are the authors; not necessarily that of OANDA Business Information & Services, Inc. or any of its affiliates, subsidiaries, officers or directors. If you would like to reproduce or redistribute any of the content found on MarketPulse, an award winning forex, commodities and global indices analysis and news site service produced by OANDA Business Information & Services, Inc., please access the RSS feed or contact us at info@marketpulse.com. Visit https://www.marketpulse.com/ to find out more about the beat of the global markets. © 2023 OANDA Business Information & Services Inc.