- An increase in expectations for a fresh Fed funds rate cut cycle to start as early as July this year has benefitted US tech equities.
- Forward-looking inflationary expectations in the US have ticked up but seem under-priced.
- Recent up move in Nasdaq 100 has started to involve into a potential bearish reversal configuration.
The recent turmoil in the regional US banking sector has triggered a credit crunch in the US economy, reinforcing the shrinkage of aggregate demand that increases the odds of a slowdown in elevated inflationary pressures when it hit close to a 40-year high in early 2022.
The latest March released US consumer inflation data has reinforced such slowdown odds as the year-on-year CPI growth rate declined to 5% from 6% printed in February, its ninth consecutive month of slowdown and below estimates of 5.2%. Meanwhile, the core inflation (excluding food & energy) ticked slightly higher to 5.6% year-on-year from February’s 5.5% but in line with estimates.
Costs incurred by US producers, the Production Price Index for March has indicated a slowdown in the growth of wholesale inflation where the PPI declined to 2.7% year-on-year from February’s 4.9%, its lowest rate of inflation since January 2021 and came in below estimates of 3%.
These softened estimates of US CPI and PPI data have led to an increased bet in the interest rates futures market that the key Fed funds rate is likely to peak at 5%-5.25% in the May FOMC meeting and the Fed is expected to start its interest rate cut cycle as soon in July with an accumulated cut of around 100 bps by end of 2023 based on the CME FedWatch Tool.
This dovish pricing is in contrast with the latest Fed’s monetary policy guide where the latest “dot-plot” of Fed funds rate median projections by FOMC members released in the previous FOMC meeting in March has indicated no interest rate cut for 2023.
Increased expectations of Fed funds rate cuts have benefited US tech equities.
Long-duration risk assets such as technology/semiconductor/communication services equities that have a high sensitivity to interest rate changes have rallied and outperformed the overall US stock market due to such dovish expectations of future Fed funds rate cuts. The Nasdaq 100 has recorded a gain of 20% in Q1 2023 over the S&P 500’s return of 7%. Meanwhile, US semiconductor stocks as represented by the iShares Semiconductors exchange-traded fund (SOXX) performed much better with a return of 28% in Q1.
Can such outperformance persistence continue for US tech equities?
The price movements in financial markets are always in flux and forward-looking, hence traders will tempt to decipher whether certain respective conditions or factors are being over-priced or under-priced as inherent in the current price levels of financial assets.
The US CPI inflation data released for the prior month is lagging in nature and it does not consider current factors that are likely to impact future inflation data for April and beyond. One way to counter this “lag” is to use either survey-based or financial market-inferred transacted data to have a gauge of forward-looking inflationary expectations which in turn are likely to influence the decision-making process of central bankers when they set monetary policies.
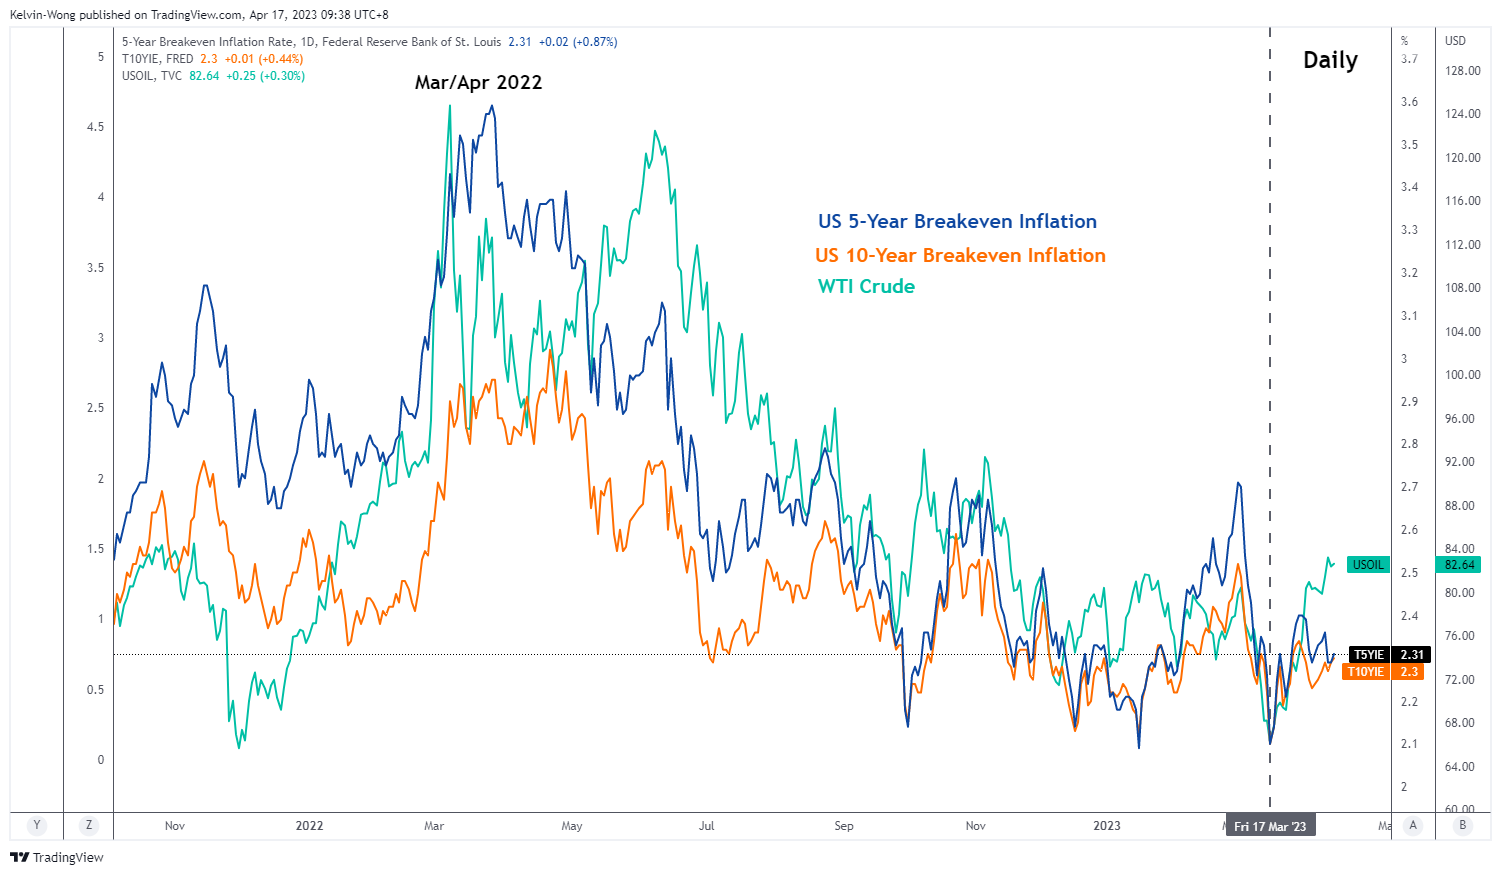
Source: TradingView as of 17 Apr 2023 (click to enlarge chart)
The latest price actions of both the 5 and 10-year US breakeven inflation rates; financial market-inferred transacted data based on the US Treasury inflation-protected securities (TIPS) that in a nutshell gives a gauge on future inflation levels in the next 5 and 10 years from today, have ticked upwards since 17 March 2023 as shown in the chart above.
Interestingly, these US breakeven inflation rates’ movements have moved in direct lockstep with WTI crude oil where we can decipher that the recent rebound in oil prices triggered by the surprise production cut by OPEC+ on 2 April has reinforced the uptick in the breakeven inflation rates.
Hence going forward, the current rebound seen in the breakeven inflation rates seems to be under-priced at this juncture which may increase the odds of profit-taking activities in the prior quarter’s high-flying US tech/semiconductor equities.
US Nas 100 Technical Analysis – at risk of a short to medium-term bearish reversal

Source: TradingView as of 17 Apr 2023 (click to enlarge chart)
The US Nas 100 Index (a proxy for the Nasdaq 100 futures) which is concentrated heavily in technology-related equities has started to evolve into a bearish “Ascending Wedge” configuration.
In the language of technical analysis speak, an “Ascending Wedge” is formed by connecting a series of “higher highs” that formed the upper boundary (resistance) of the wedge and in conjunction, a series of “lower lows” that is the lower boundary (support) of the wedge.
We can notice that the slope of the upper boundary of the “Ascending Wedge” that connects the “higher highs” is flatter (lesser in magnitude) versus its lower boundary which implies that the positive rate of change of the price actions of the Index has started to lose momentum. Thus, such price actions of an “Ascending Wedge” have led it to be termed a bearish reversal price pattern.
In addition, the RSI momentum indicator has flashed a bearish divergence signal at its overbought zone which also indicates a slowdown in upside momentum of the recent up move in price actions of the Index in place since the 13 March 2023 low of 11,676.
If the 13,720 key medium-term pivotal resistance is not surpassed to the upside, a break below 12,765 may see a further decline to retest the lower boundary of the “Ascending Wedge” now acting as a support at 12,300 in the first step. However, a clearance with a daily close above 13,720 sees the continuation of the medium-term uptrend towards the next resistance at 15,270 (also the swing highs of 2 February/ 31 March 2022).
Content is for general information purposes only. It is not investment advice or a solution to buy or sell securities. Opinions are the authors; not necessarily that of OANDA Business Information & Services, Inc. or any of its affiliates, subsidiaries, officers or directors. If you would like to reproduce or redistribute any of the content found on MarketPulse, an award winning forex, commodities and global indices analysis and news site service produced by OANDA Business Information & Services, Inc., please access the RSS feed or contact us at info@marketpulse.com. Visit https://www.marketpulse.com/ to find out more about the beat of the global markets. © 2023 OANDA Business Information & Services Inc.

Kelvin Wong
Passionate about connecting the dots in the financial markets and sharing perspectives around trading and investment, Kelvin Wong is an expert in using a unique combination of fundamental and technical analyses, specializing in Elliott Wave and fund flow positioning, to pinpoint key reversal levels in the financial markets.
In addition, over the last ten years, Kelvin has conducted numerous market outlook and trading-related seminars, as well as technical analysis training courses, for thousands of retail traders.
Latest posts by Kelvin Wong (see all)
- Gold Technical: The recent sell-off may have reached a potential bullish reversal level at US$2,353 - 26 July 2024
- SPX 500: Further weakness may trigger a medium-term global risk-off event - 25 July 2024
- Nasdaq 100: Potential bullish reversal looms ahead of Alphabet and Tesla earnings results - 23 July 2024