- The 2-day rebound seen in USD/JPY has reached 146.20/70 minor resistance zone.
- The movement of USD/JPY in the past month has a significant direct correlation with the US 10-year Treasury/10-year JGB yield spread.
- The short-term to medium-term trends of the US 10-year Treasury/10-year JGB yield spread remain bearish.
- Watch the 146.70 key short-term resistance on USD/JPY.
This is a follow-up analysis of our prior report, “USD/JPY Technical: Potential counter-trend rebound within medium-term downtrend” published on 8 December 2023. Click here for a recap.
USD/JPY has rebounded and hit the short-term resistance zones of 144.80/145.30 and 146.20/70 as highlighted in our previous analysis reinforced by the better-than-expected US non-farm payrolls data for November and a media report released yesterday, 11 December that stated the Bank of Japan (BoJ) officials were in no rush to scrap short-term negative interest in the upcoming 18 to 19 December monetary policy meeting according to sources.
This latest set of “BoJ’s monetary policy thought process” reported by the media contrasted with the hawkish remarks made by BoJ Governor Ueda and Deputy Governor Himino last week that increased market speculations that the decade-plus of short-term negative interest rate policy in Japan may be scrapped sooner than expected.
The USD/JPY extended its gains from last Friday and rallied by +0.86% to print an intraday high of 146.59 as seen in yesterday’s 11 December US session on the backdrop of the media report.
It’s all about the yield spread between the US 10-year Treasury & 10-year JGB
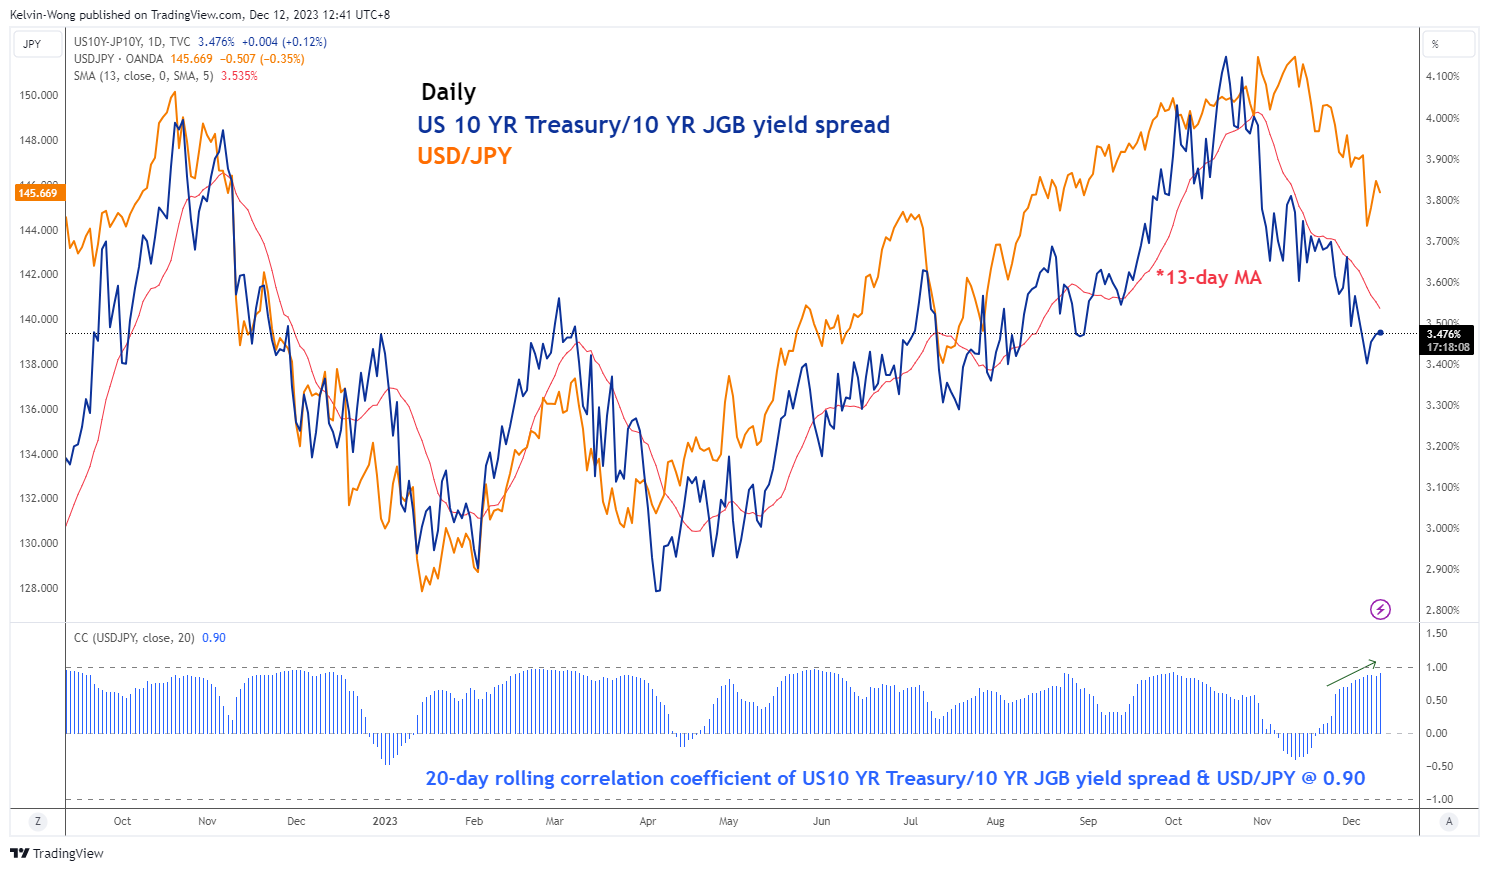
Fig 1: Movement of USD/JPY and US 10-year Treasury/10-year JGB yield spread as of 12 Dec 2023 (Source: TradingView, click to enlarge chart)
Interestingly, the movement of the USD/JPY in the past month has moved in sync with the yield spread of the US 10-year Treasury/10-year Japanese government bonds (JGB) which can be considered as an indirect summation net effect of monetary policy guidance from the Fed and BoJ.
Their current 20-day rolling correlation coefficient is at 0.90 which suggests that the movement of the US 10-year Treasury/10-year JGB yield spread has a significant direct influence on the movement of the USD/JPY.
If the US 10-year Treasury/10-year JGB yield spread compressed (inched downwards), the movement of the USD/JPY reflected a similar directional move on the downside and vice versus if the yield spread expanded to the upside.
Overall, the short to medium-term trend phases of the US 10-year Treasury/10-year JGB yield spread is still bearish as it continues to trend below its downward sloping 13-day moving average. Hence, it may put further downside pressure on the USD/JPY.
USD/JPY’s recent minor rally may have exhausted
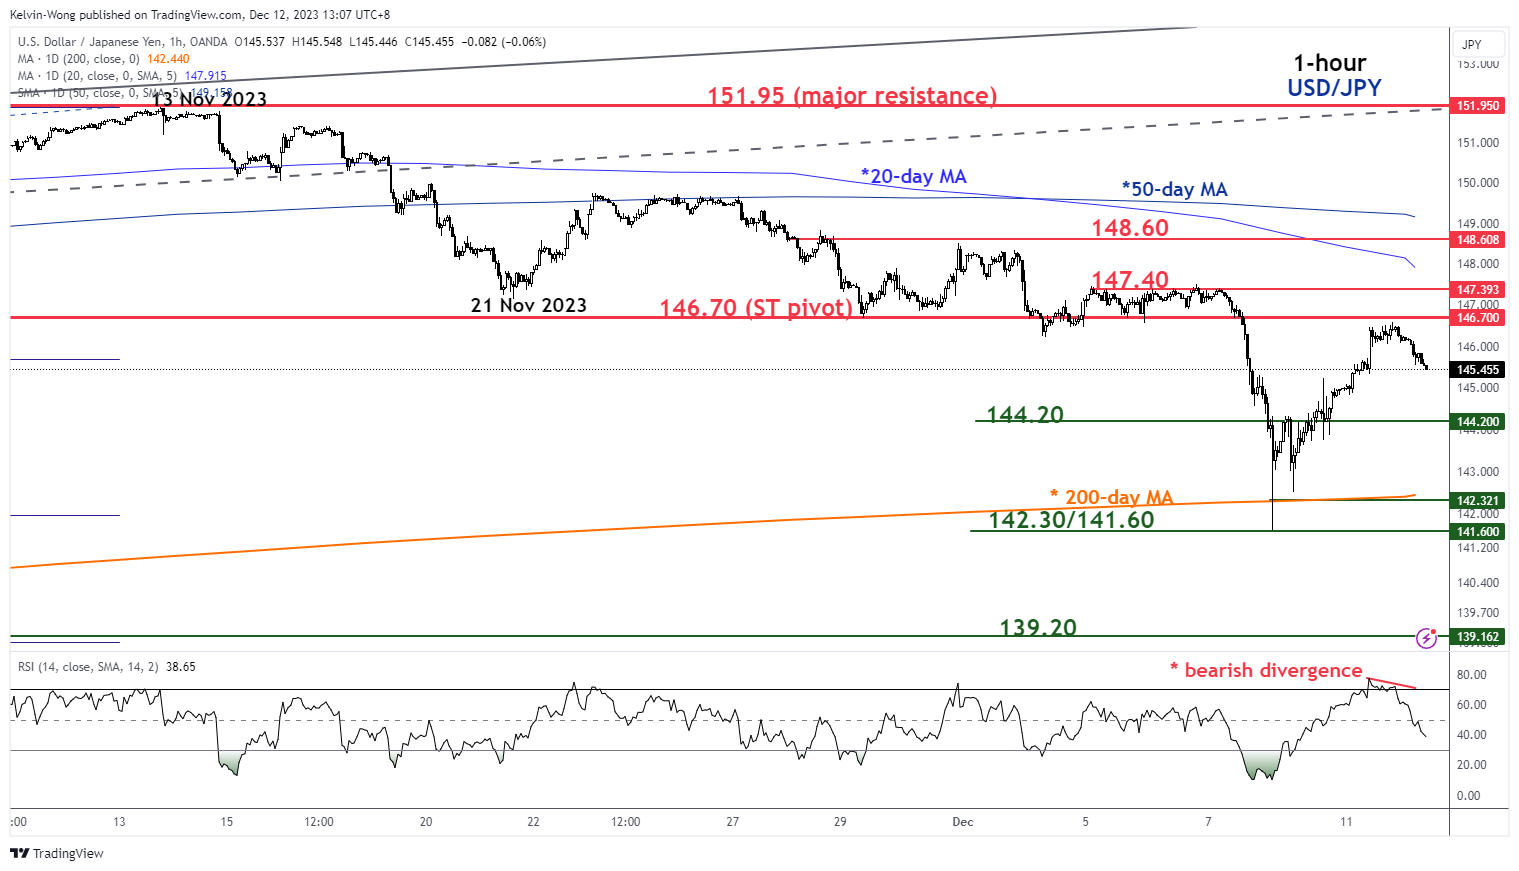
Fig 2: USD/JPY short-term minor trend as of 12 Dec 2023 (Source: TradingView, click to enlarge chart)
The price actions of the USD/JPY have staged a bearish reaction after 2-day of counter-trend rebound at the 146.70 short-term pivotal resistance (former minor swing lows area of 4/5 December 2023 & 50% Fibonacci retracement of the prior minor downtrend phase from 13 November 2023 high to 7 December 2023 low).
In addition, the hourly RSI momentum indicator has flashed out a bearish divergence condition at its overbought condition during yesterday’s US session which suggests that the bullish momentum of the 2-day rally is likely to be exhausted.
Near-term support will be at 144.20 and a break below it exposes the next intermediate support zone of 142.20/141.60 (coincides with the 200-day moving average).
On the flip side, a clearance above 146.70 sees a potential extension of the counter-trend rebound towards the medium-term resistance zone of 147.40/148.60 (coincides with the downward sloping 20 and 50-day moving averages).
Content is for general information purposes only. It is not investment advice or a solution to buy or sell securities. Opinions are the authors; not necessarily that of OANDA Business Information & Services, Inc. or any of its affiliates, subsidiaries, officers or directors. If you would like to reproduce or redistribute any of the content found on MarketPulse, an award winning forex, commodities and global indices analysis and news site service produced by OANDA Business Information & Services, Inc., please access the RSS feed or contact us at info@marketpulse.com. Visit https://www.marketpulse.com/ to find out more about the beat of the global markets. © 2023 OANDA Business Information & Services Inc.

Kelvin Wong
Passionate about connecting the dots in the financial markets and sharing perspectives around trading and investment, Kelvin Wong is an expert in using a unique combination of fundamental and technical analyses, specializing in Elliott Wave and fund flow positioning, to pinpoint key reversal levels in the financial markets.
In addition, over the last ten years, Kelvin has conducted numerous market outlook and trading-related seminars, as well as technical analysis training courses, for thousands of retail traders.
Latest posts by Kelvin Wong (see all)
- Gold Technical: The recent sell-off may have reached a potential bullish reversal level at US$2,353 - 26 July 2024
- SPX 500: Further weakness may trigger a medium-term global risk-off event - 25 July 2024
- Nasdaq 100: Potential bullish reversal looms ahead of Alphabet and Tesla earnings results - 23 July 2024