- Heightened dovish expectations on US monetary policy have led to US Treasuries-JGBs yield premium shrinkage.
- Bearish momentum factor has taken a foothold as well with USD/JPY’s price action below its 20 and 50-day moving averages.
- Watch the 150.30/70 key medium-term resistance zone.
The relentless medium-term impulsive upside movements of the USD/JPY in place since the 16 January 2022 low of 127.22 are likely to have succumbed to the “law of gravity” triggered by momentum and fundamental factors.
In the past week, the USD/JPY has weakened considerably as its one-month rolling performance as of today, 20 November has slipped to -0.54% at this time of the writing (see Figure 1).
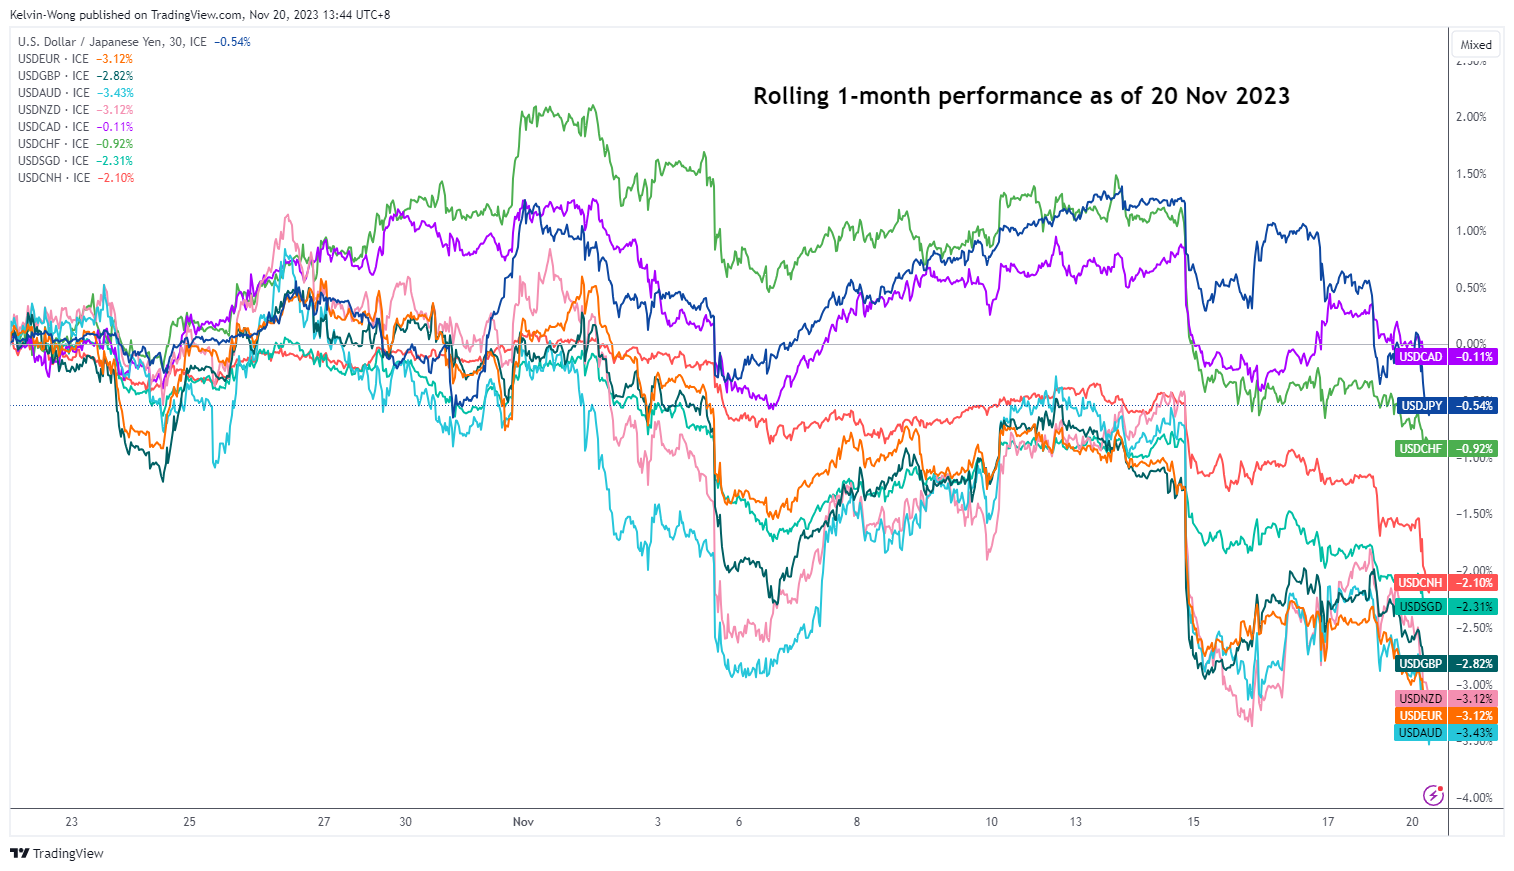
Fig 1: Rolling 1-month performances of major US dollar pairs as of 20 Nov 2023 (Source: TradingView, click to enlarge chart)
External fundamental factors seem to be at play at this juncture rather than Japan’s elevated sticky inflation or the Ministry of Finance’s threat of intervention in the foreign exchange market.
The swing of the pendulum has now shifted abruptly on the expectations of the potential last interest rate hike by the US Federal Reserve to bring its terminal Fed funds rate to 5.50%-5.75% based on the current 2023 “dot-plot” projection of 5.6% as released during the September 2023 FOMC meeting.
Right now, US monetary policy is expected to be less restrictive going forward in the first half of 2024 where the anticipated potential last Fed’s interest rate hike pencilled in the December 2023 and January 2024 FOMC meetings have evaporated into thin air reinforced by the softer US CPI print for October.
Based on the latest data from the CME FedWatch Tool derived from the pricing of the 30-day Fed funds futures, there is now zero chance of any Fed funds interest rate hike next month and for the entire FOMC meetings in 2024. In addition, there is a 30% chance of a first interest rate cut to come as early as March 2024, followed by 64% and 84% chances of a rate cut in May and June 2024 respectively.
US Treasury yield premium has narrowed against JGB
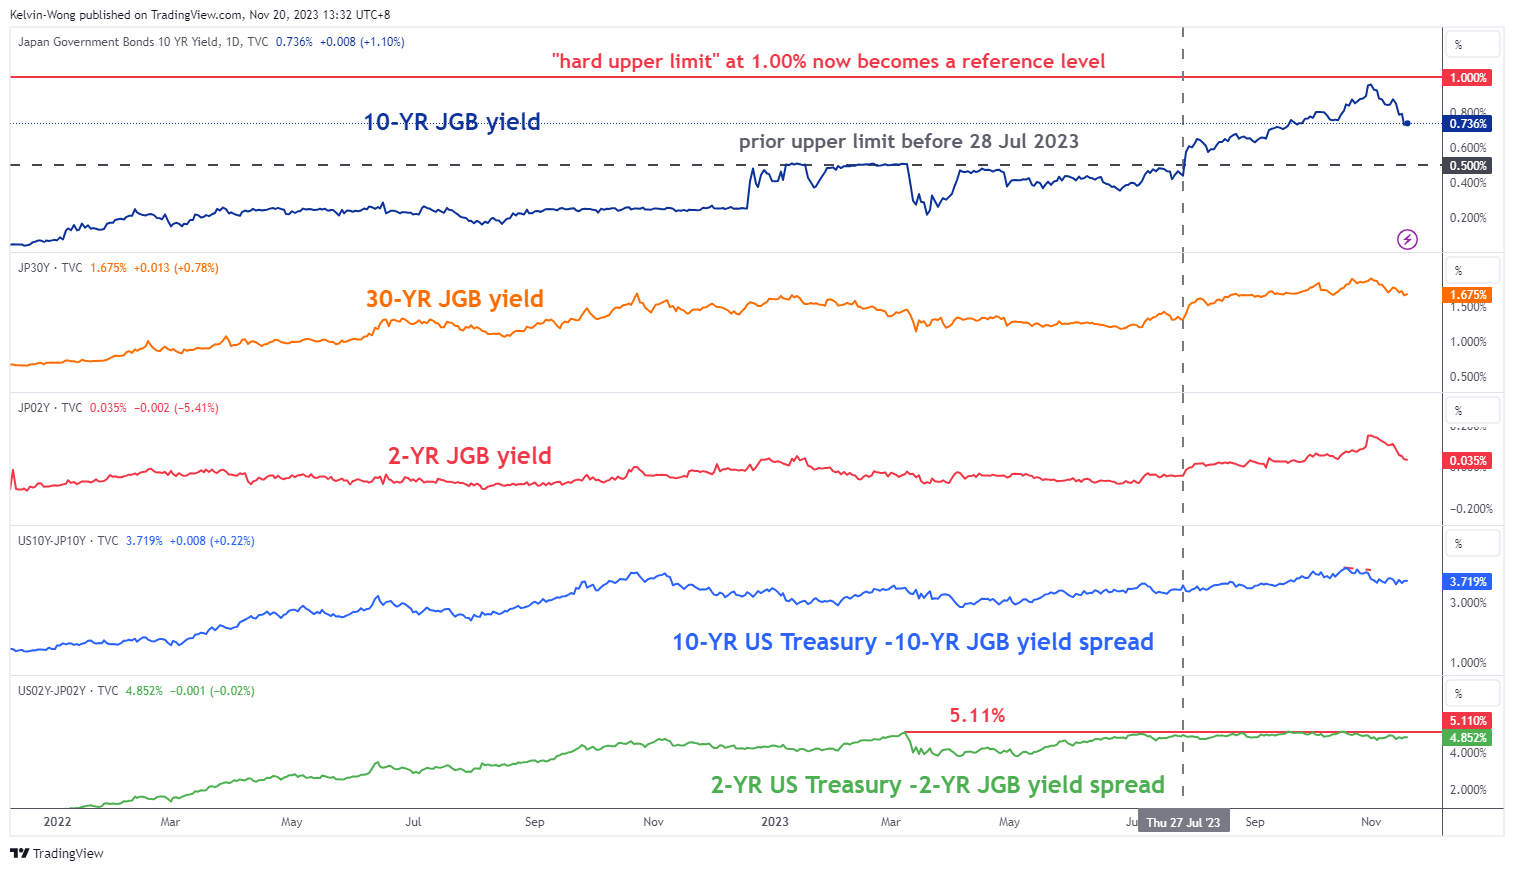
Fig 2: JGB yields with US Treasury-JGB yield spreads as of 20 Nov 2023 (Source: TradingView, click to enlarge chart)
The recent heightened dovish expectations in US monetary policy have led to a bout of softness in US Treasury yields after torrid rallies seen since May 2023.
In the past month, the 10-year yield spread between the US Treasury notes and the Japanese government bonds (JGBs) has narrowed by 55 basis points (bps) from 4.15% to 3.60% printed last Tuesday, 14 November.
The current US Treasury-JGB yield premium shrinkage in the 10-year is the most since the period of March-April 2024. Also, the shorter-term 2-year US Treasury-JGB yield premium has traded sideways below a key resistance of 5.11% since March 2023 (see Figure 2).
All in all, this yield premium shrinkage in US Treasuries has led it to be less attractive for Japanese investors in terms of yield capture which in turn put indirect downside pressure on the USD/JPY foreign exchange rate.
USD/JPY has broken below its 20 and 50-day moving averages
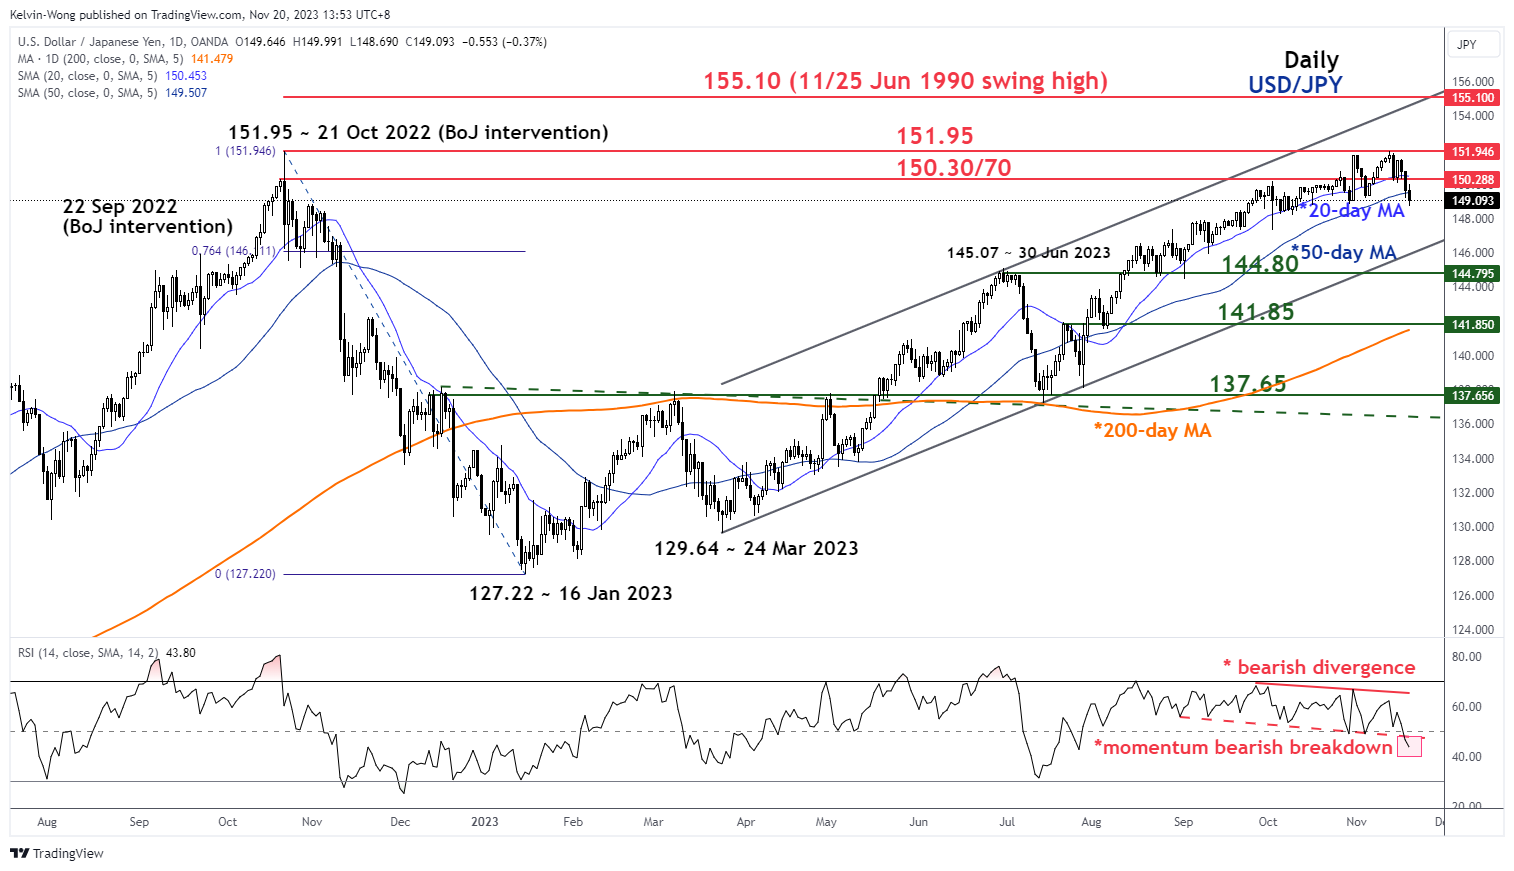
Fig 3: USD/JPY medium-term trend as of 20 Nov 2023 (Source: TradingView, click to enlarge chart)
The current price action of USD/JPY is now trading below its prior upward-sloping 20 and 50-day moving averages after a bearish reaction last Monday, 13 November (printed an intraday high of 151.91) right below the 151.95 major resistance.
In addition, its daily RSI oscillator has just triggered a momentum bearish breakdown below its 50 level after a bearish divergence condition that was flashed out on 31 October 2023 near its overbought region.
These observations suggest that the medium-term uptrend of USD/JPY in place since the 16 January 2023 low of 127.22 is in jeopardy (see Figure 3).
If the key medium-term resistance zone of 150.30/70 is not surpassed to the upside, USD/JPY is likely to stage a potential multi-week impulsive down move sequence towards the 144.80 medium-term support (former swing high area of 30 June 2023 & close to the lower boundary of the ascending channel from 24 March 2023 low) in the first step.
Content is for general information purposes only. It is not investment advice or a solution to buy or sell securities. Opinions are the authors; not necessarily that of OANDA Business Information & Services, Inc. or any of its affiliates, subsidiaries, officers or directors. If you would like to reproduce or redistribute any of the content found on MarketPulse, an award winning forex, commodities and global indices analysis and news site service produced by OANDA Business Information & Services, Inc., please access the RSS feed or contact us at info@marketpulse.com. Visit https://www.marketpulse.com/ to find out more about the beat of the global markets. © 2023 OANDA Business Information & Services Inc.