- The recent four months of bullish acceleration may have reached a major climax condition at 166.60 resistance.
- The short-term minor trend of CHF/JPY has turned bearish as it traded below the prior upward-sloping 20-day moving average.
- Watch the key short-term resistance at 165.60 on CHF/JPY.
This is a follow-up analysis of our prior report, “CHF/JPY Technical: Relentless uptrend movement” published on 31 August 2023. Click here for a recap.
After recording an accumulated gain of +2,378 pips since January 2023, the cross pair CHF/JPY seems to have lost its bullish mojo as it failed to make any headway above the 166.60 key major resistance and broke below its medium-term support at 164.50 (defined by the lower boundary of an ascending channel from 20 March 2023 low) yesterday, 11 September.
A major bullish climax may have been reached
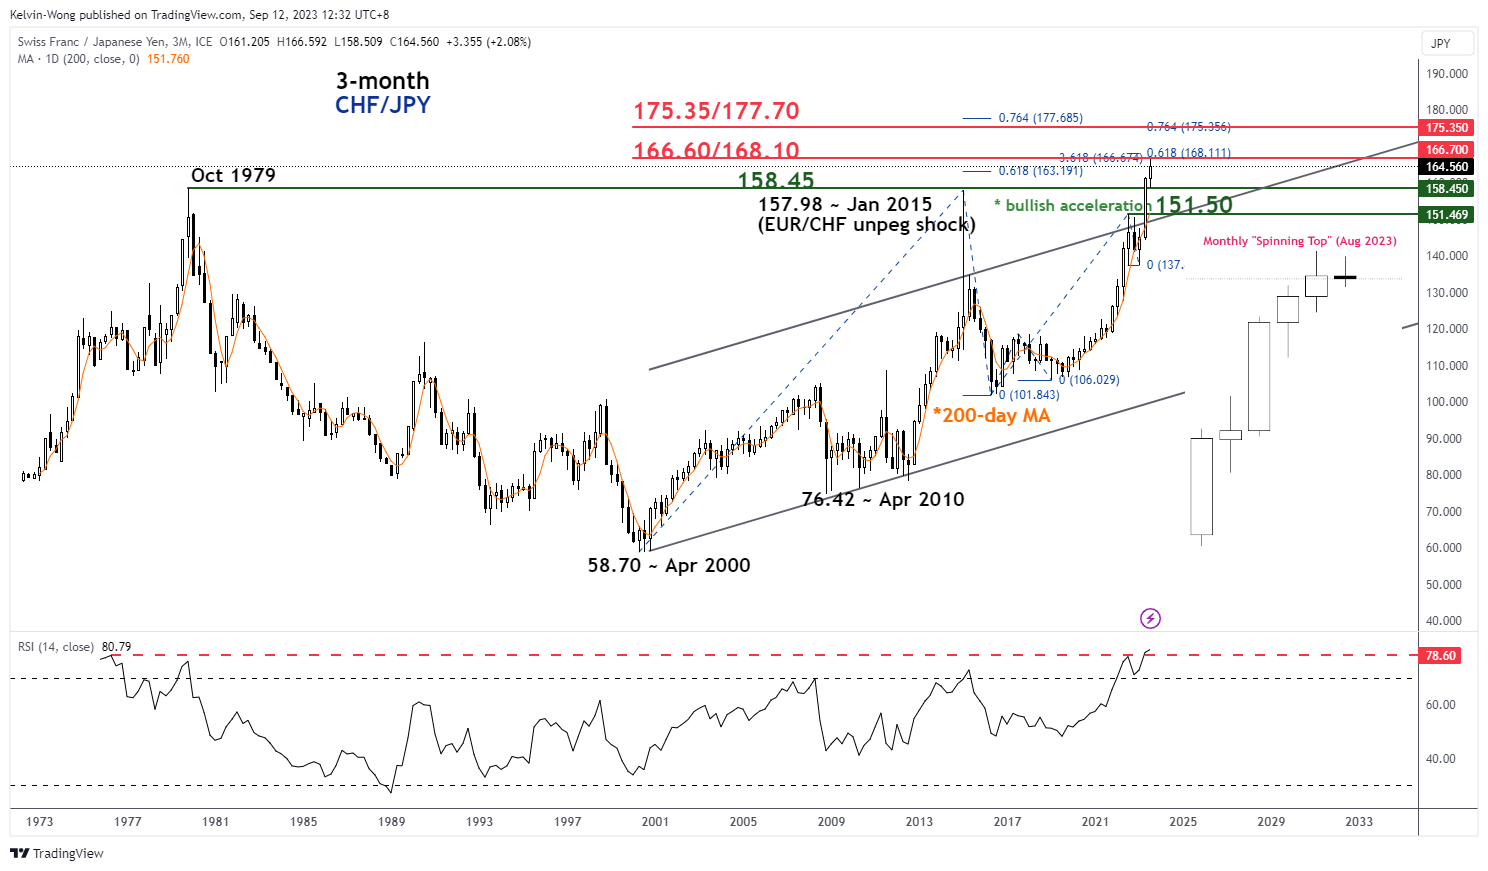
Fig 1: CHF/JPY long-term term secular trend as of 12 Sep 2023 (Source: TradingView, click to enlarge chart)
The recent bullish acceleration move in the past four months may have reached a climax where price actions at the end of August 2023 formed a monthly bearish “Spinning Top” candlestick pattern coupled with the 3-month RSI oscillator hitting an extreme all-time high overbought level of 80.79 at this time of the writing based on data available since April 1972.
Short-term momentum has turned bearish
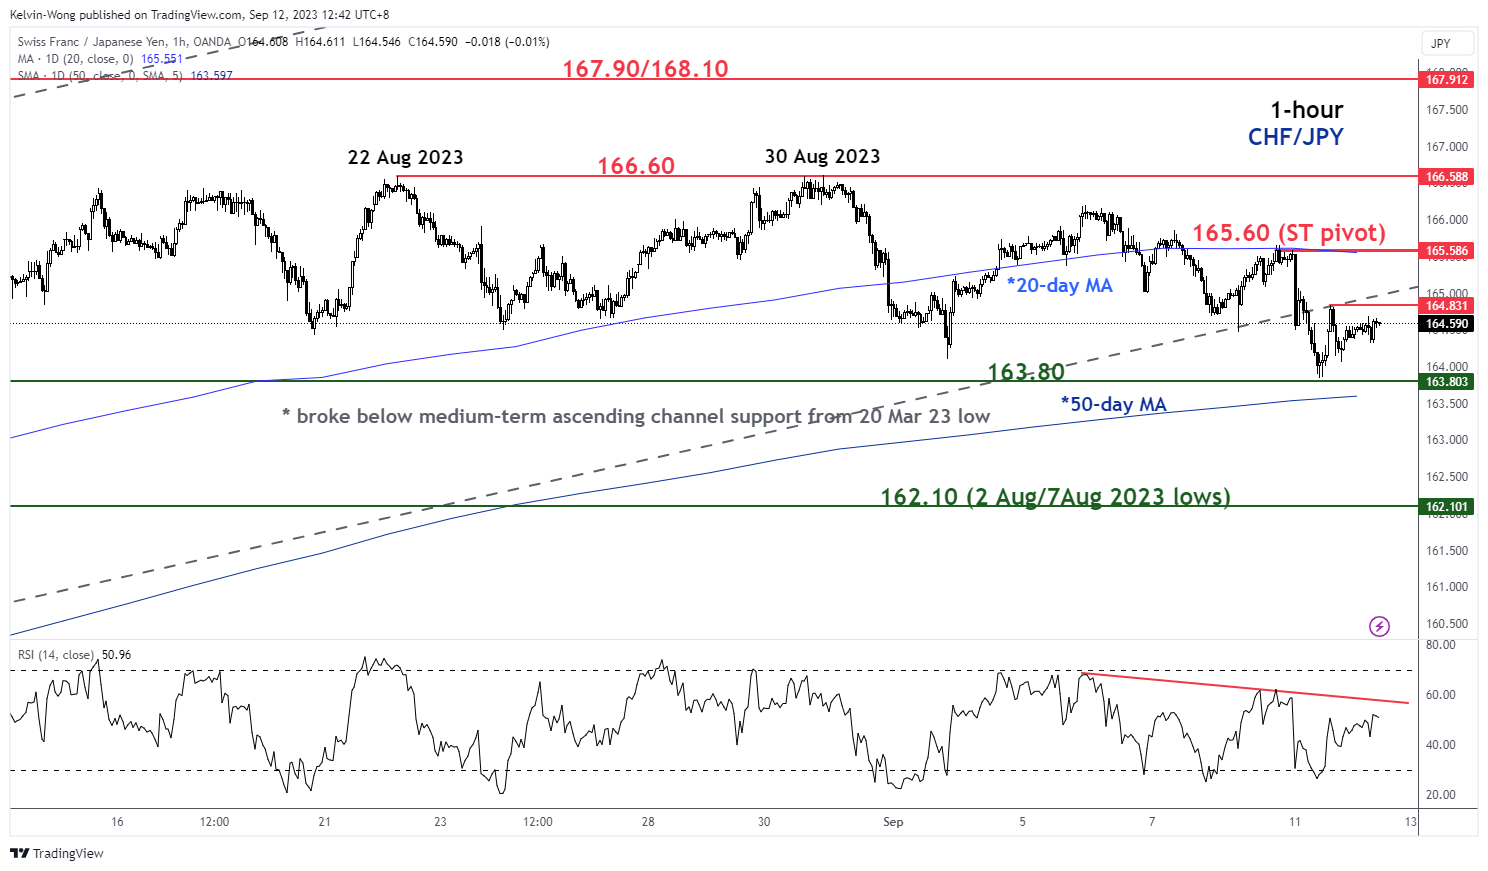
Fig 2: CHF/JPY minor short-term trend as of 12 Sep 2023 (Source: TradingView, click to enlarge chart)
Since 7 September 2022, the CHF/JPY has pierced below its 20-day moving average and started to form a series of “lower highs” and “lower lows”.
In conjunction with the 1-hour RSI oscillator that has also traced out similar “lower highs” below a parallel descending resistance at the 57-level which suggests short-term bearish momentum of price actions remains intact.
Watch the 165.60 key short-term pivotal resistance (also the 20-day moving average) and a break below the intermediate support at 163.80 (former minor range resistance of 21 July to 8 August 2023 & the 50-day moving average) may trigger a further impulsive slide to see the next support coming in at 162.10 in the first step.
However, a clearance above 165.60 negates the bearish tone for a push-up to retest the 166.60 key major resistance.
Content is for general information purposes only. It is not investment advice or a solution to buy or sell securities. Opinions are the authors; not necessarily that of OANDA Business Information & Services, Inc. or any of its affiliates, subsidiaries, officers or directors. If you would like to reproduce or redistribute any of the content found on MarketPulse, an award winning forex, commodities and global indices analysis and news site service produced by OANDA Business Information & Services, Inc., please access the RSS feed or contact us at info@marketpulse.com. Visit https://www.marketpulse.com/ to find out more about the beat of the global markets. © 2023 OANDA Business Information & Services Inc.

Kelvin Wong
Passionate about connecting the dots in the financial markets and sharing perspectives around trading and investment, Kelvin Wong is an expert in using a unique combination of fundamental and technical analyses, specializing in Elliott Wave and fund flow positioning, to pinpoint key reversal levels in the financial markets.
In addition, over the last ten years, Kelvin has conducted numerous market outlook and trading-related seminars, as well as technical analysis training courses, for thousands of retail traders.
Latest posts by Kelvin Wong (see all)
- Gold Technical: The recent sell-off may have reached a potential bullish reversal level at US$2,353 - 26 July 2024
- SPX 500: Further weakness may trigger a medium-term global risk-off event - 25 July 2024
- Nasdaq 100: Potential bullish reversal looms ahead of Alphabet and Tesla earnings results - 23 July 2024