- Bearish readings seen in the daily and hourly RSI momentum indicators have reinforced the weakening medium-term and short-term impulsive up moves of CHF/JPY.
- Watch the key short-term resistance at 169.65 for CHF/JPY.
The major uptrend phase of the CHF/JPY has started to show signs of bullish exhaustion at this juncture which increases the risk of a multi-week corrective decline to retest its 50-day moving and the median line of a major ascending channel in place since 13 January 2023 low, acting at a support zone of 166.55/165.10.
Daily RSI has broken below its former ascending support
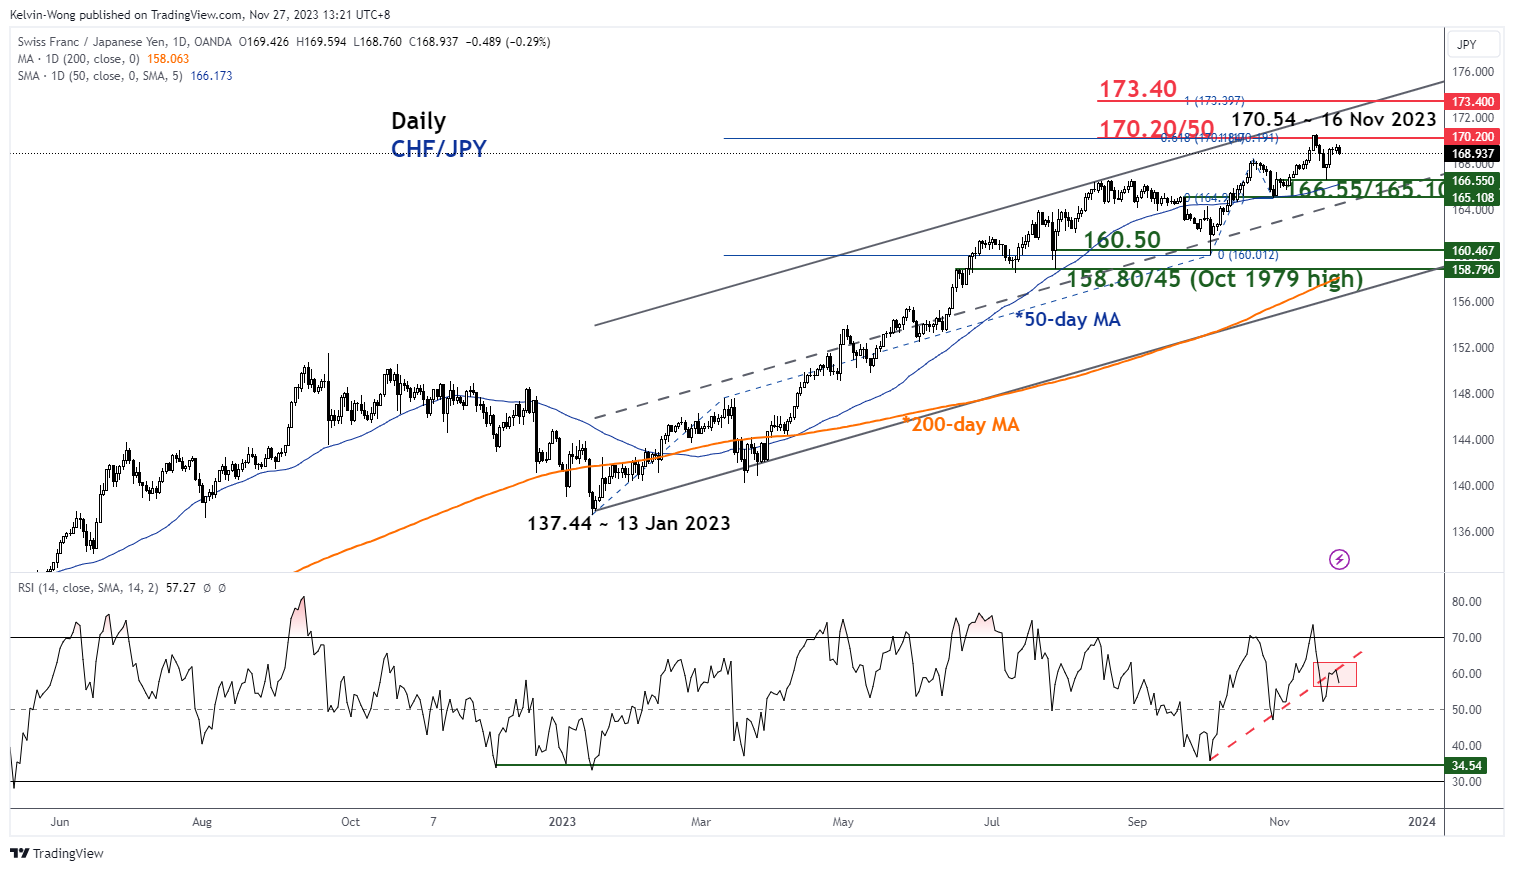
Fig 1: CHF/JPY major & medium-term trends as of 27 Nov 2023 (Source: TradingView, click to enlarge chart)
The medium-term bullish momentum of CHF/JPY from the 3 October 2023 low of 160.00 has started to dissipate where the daily RSI momentum indicator has staged a recent bearish breakdown on 20 November and retested its former parallel support at the 60 level.
Watch the key short-term resistance at 169.65
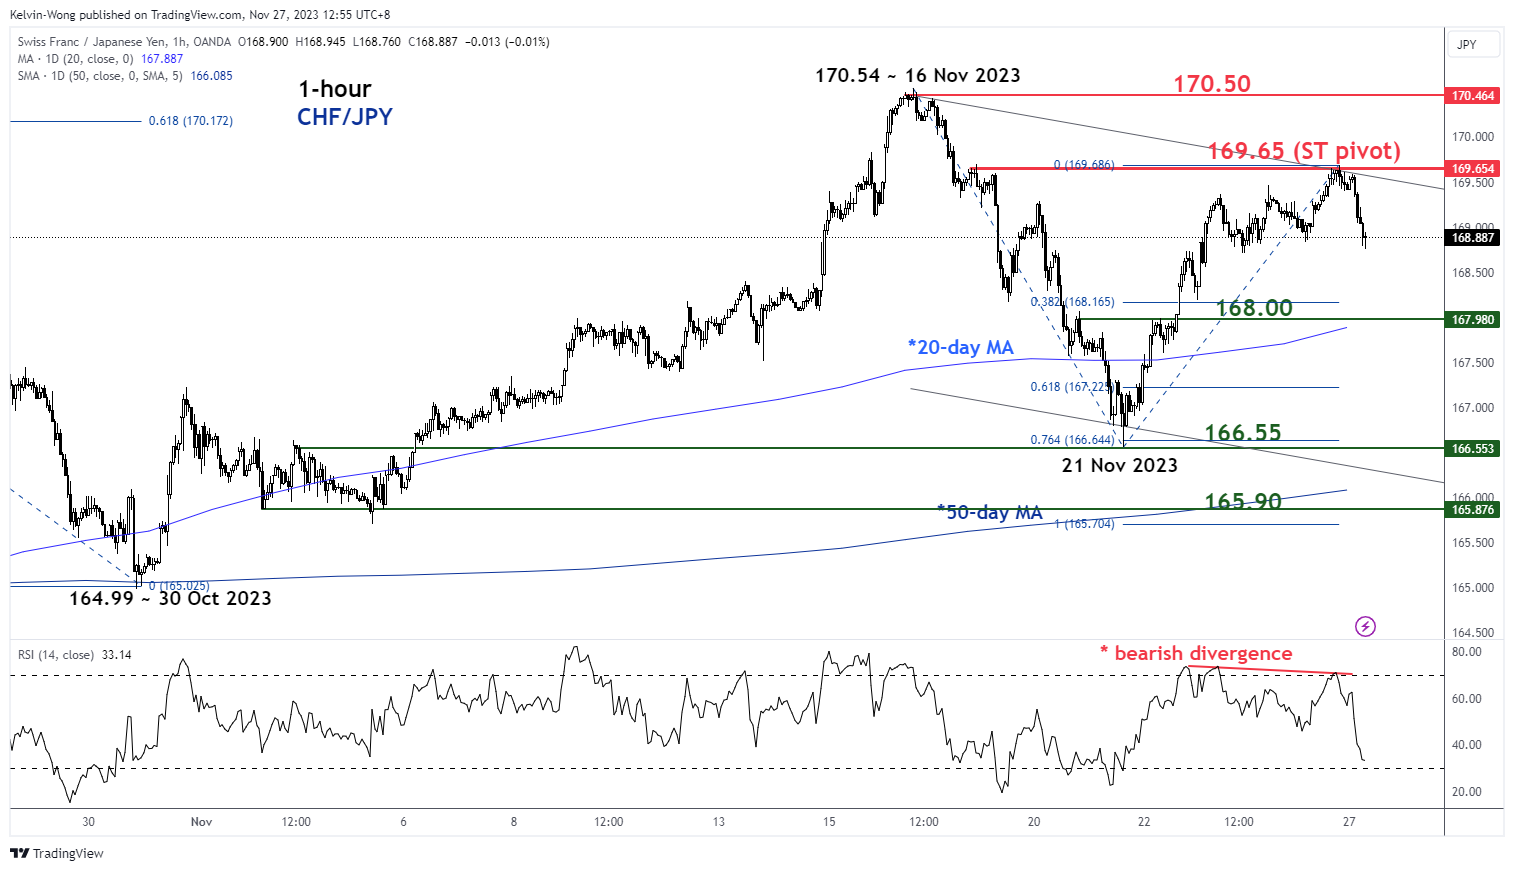
Fig 2: CHF/JPY minor short-term trend as of 27 Nov 2023 (Source: TradingView, click to enlarge chart)
In the shorter time frame as seen on the 1-hour chart, the price actions of CHF/JPY have started to oscillate within an impending minor descending channel from its recent all-time high print of 170.54 on 16 November 2023.
Also, the hourly RSI momentum indicator has flashed out a bearish divergence condition at its overbought region.
All in all, these observations have advocated the start of a potential multi-week corrective decline scenario for CHF/JPY.
If the 169.65 key short-term pivotal resistance is not surpassed to the upside, the CHF/JPY cross pair may see a slide to retest the near-term support of 168.00 (also the 20-day moving average), and below it exposes the next intermediate supports at 166.55 and 165.90 next (also the 50-day moving average and the lower boundary of the minor descending channel).
However, a clearance above 169.65 invalidates the bearish scenario for a retest on the 170.50 major resistance.
Content is for general information purposes only. It is not investment advice or a solution to buy or sell securities. Opinions are the authors; not necessarily that of OANDA Business Information & Services, Inc. or any of its affiliates, subsidiaries, officers or directors. If you would like to reproduce or redistribute any of the content found on MarketPulse, an award winning forex, commodities and global indices analysis and news site service produced by OANDA Business Information & Services, Inc., please access the RSS feed or contact us at info@marketpulse.com. Visit https://www.marketpulse.com/ to find out more about the beat of the global markets. © 2023 OANDA Business Information & Services Inc.