The AUD/JPY cross pair tends to be used as a proxy for “risk-on/risk-off” behaviour where a clear uptrend movement can be considered as a persistent “risk-on-herding” behaviour is at play and vice versa.
In the past four weeks, the AUD/JPY has rallied by +445 pips from its 16 October 2023 low of 94.14 to the recent 16 November 2023 high of 98.58 which was in line with the rallies seen in major benchmark stock indices.
This risk-on behaviour has been driven by the anticipation that the US Federal Reserve has reached the peak of its current interest rate hike cycle with a potential terminal rate of 5.25%-5.50% on the Fed funds rate.
98.40 long-term secular resistance remains a key hurdle for the bulls
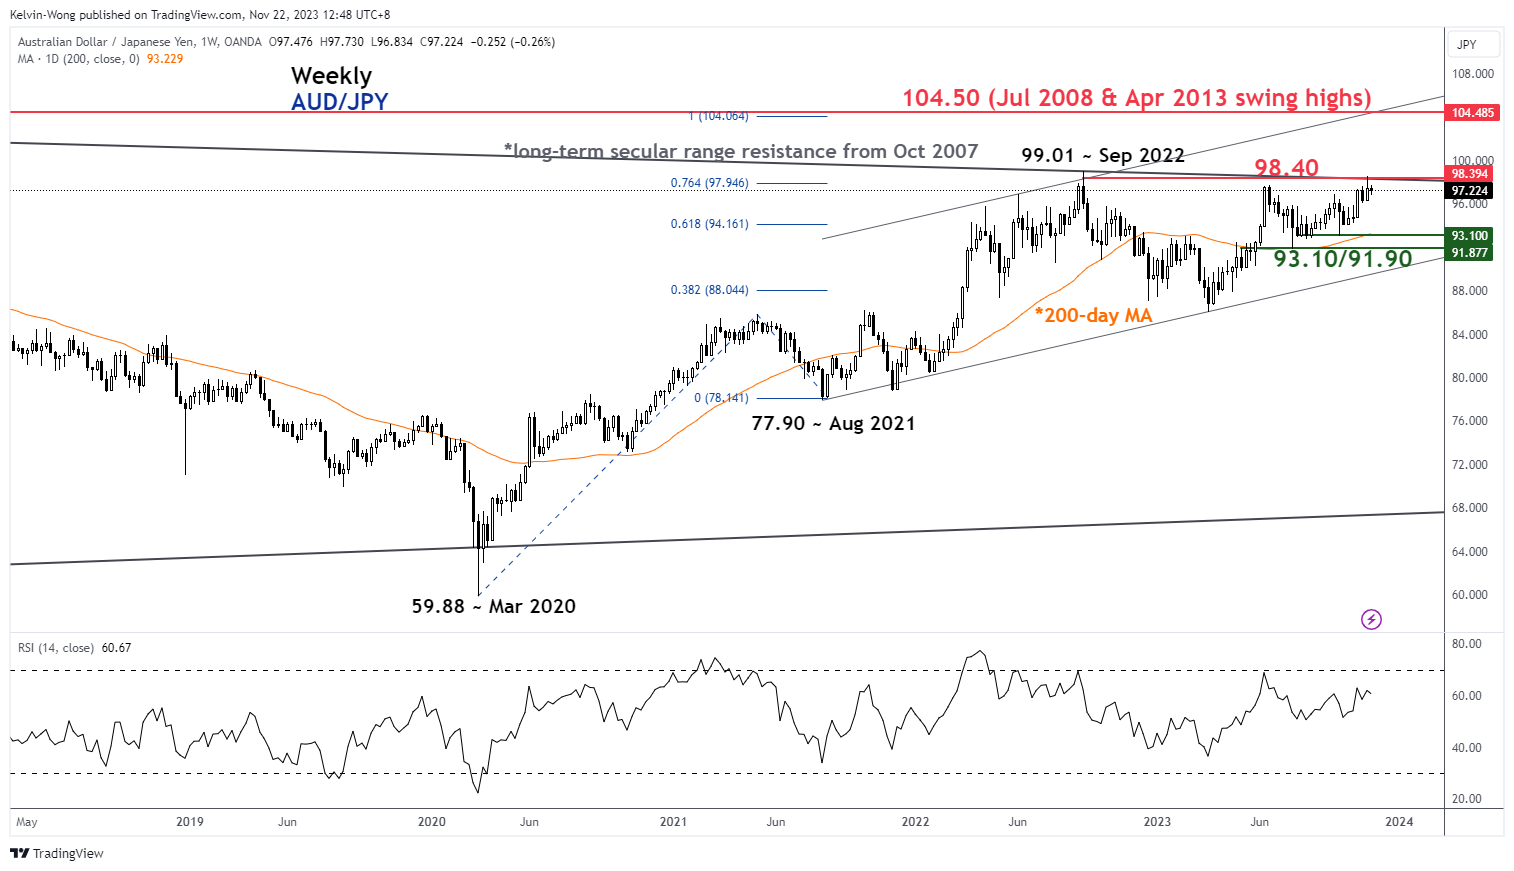
Fig 1: AUD/JPY major trend as of 22 Nov 2023 (Source: TradingView, click to enlarge chart)
The recent push-up in price actions also saw a fourth retest on its long-term secular descending range in place since the October 2007 major swing high now acting as resistance at 98.40.
Only a clear weekly close above 98.40 may trigger a major bullish breakout where a multi-month uptrend phase may occur with the next major resistance coming in at 104.50 (upper boundary of a major ascending channel from August 2021 low, major swing highs of July 2008/April 2013 & 1.00 Fibonacci extension from March 2020 low).
Short-term downside momentum has started to dissipate
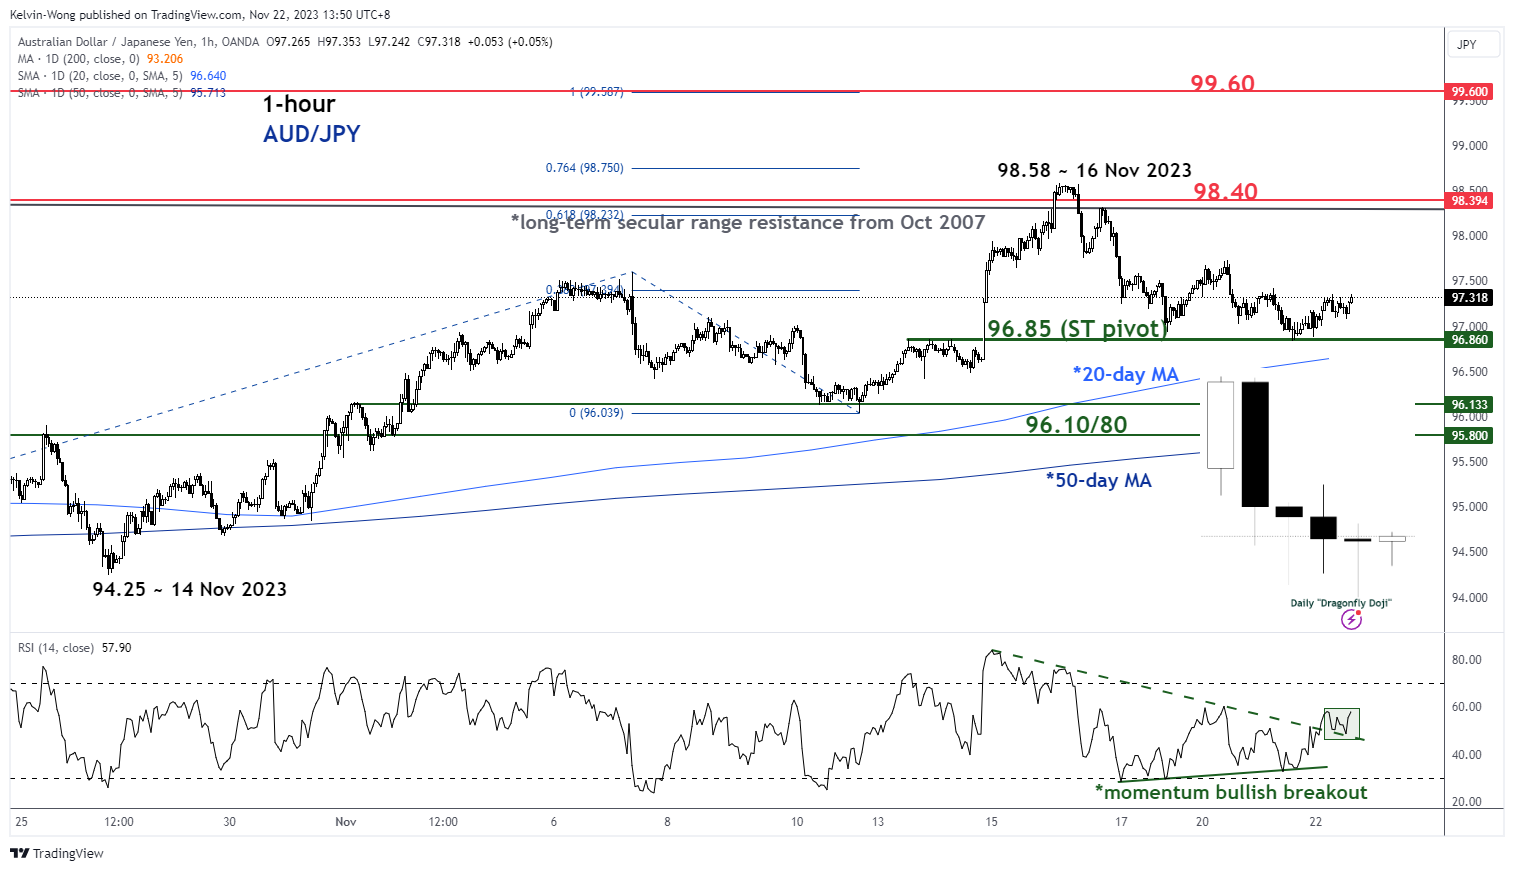
Fig 2: AUD/JPY minor short-term trend as of 22 Nov 2023 (Source: TradingView, click to enlarge chart)
In the past week, the AUD/JPY has started to retrace its recent gains with a decline of -175 pips from its 16 November 2023 high of 98.58 to print a recent low of 96.83 yesterday, 21 November.
Interestingly, yesterday’s price action has formed a daily bullish reversal “Dragonfly Doji” candlestick, a whisker above the 20-day moving average.
In addition, the hourly RSI momentum indicator has staged a bullish breakout above the 50 level, suggesting a potential revival of short-term bullish momentum.
These observations suggest the prior four days of decline have started to exhibit signs of a potential bullish reversal. Watch the 96.85 key short-term pivotal support (also the 20-day moving average) for a potential retest on the 98.40 key long-term secular resistance.
However, a break below 96.85 negates the bullish tone to expose the next intermediate support zone of 96.10/96.80 (also the 50-day moving average).
Content is for general information purposes only. It is not investment advice or a solution to buy or sell securities. Opinions are the authors; not necessarily that of OANDA Business Information & Services, Inc. or any of its affiliates, subsidiaries, officers or directors. If you would like to reproduce or redistribute any of the content found on MarketPulse, an award winning forex, commodities and global indices analysis and news site service produced by OANDA Business Information & Services, Inc., please access the RSS feed or contact us at info@marketpulse.com. Visit https://www.marketpulse.com/ to find out more about the beat of the global markets. © 2023 OANDA Business Information & Services Inc.