- Last Monday’s Asia session (9 October) gap up in price actions seen in WTI crude oil has been filled at the US$83.20 support on Thursday, 12 October.
- A positive follow-through was seen on last Friday, 13 October where its price actions ended with a daily bullish “Marubozu” reversal candlestick pattern.
- Watch the intermediate resistance at US$88.60 which also confluences with the 20-day moving average.
A volatile week for oil prices on the backdrop of escalating geopolitical tensions in the ongoing Israel-Hamas conflict that can potentially spill over to the rest of the Middle East region.
The initial gap up in price actions of around +3% in WTI crude oil futures that ignited during the start of last Monday, 9 October Asian session managed to fill the gap on Thursday, 12 October at the US$83.20 support level before it staged a bullish reversal on Friday, 13 October.
Revival of medium-term bullish momentum
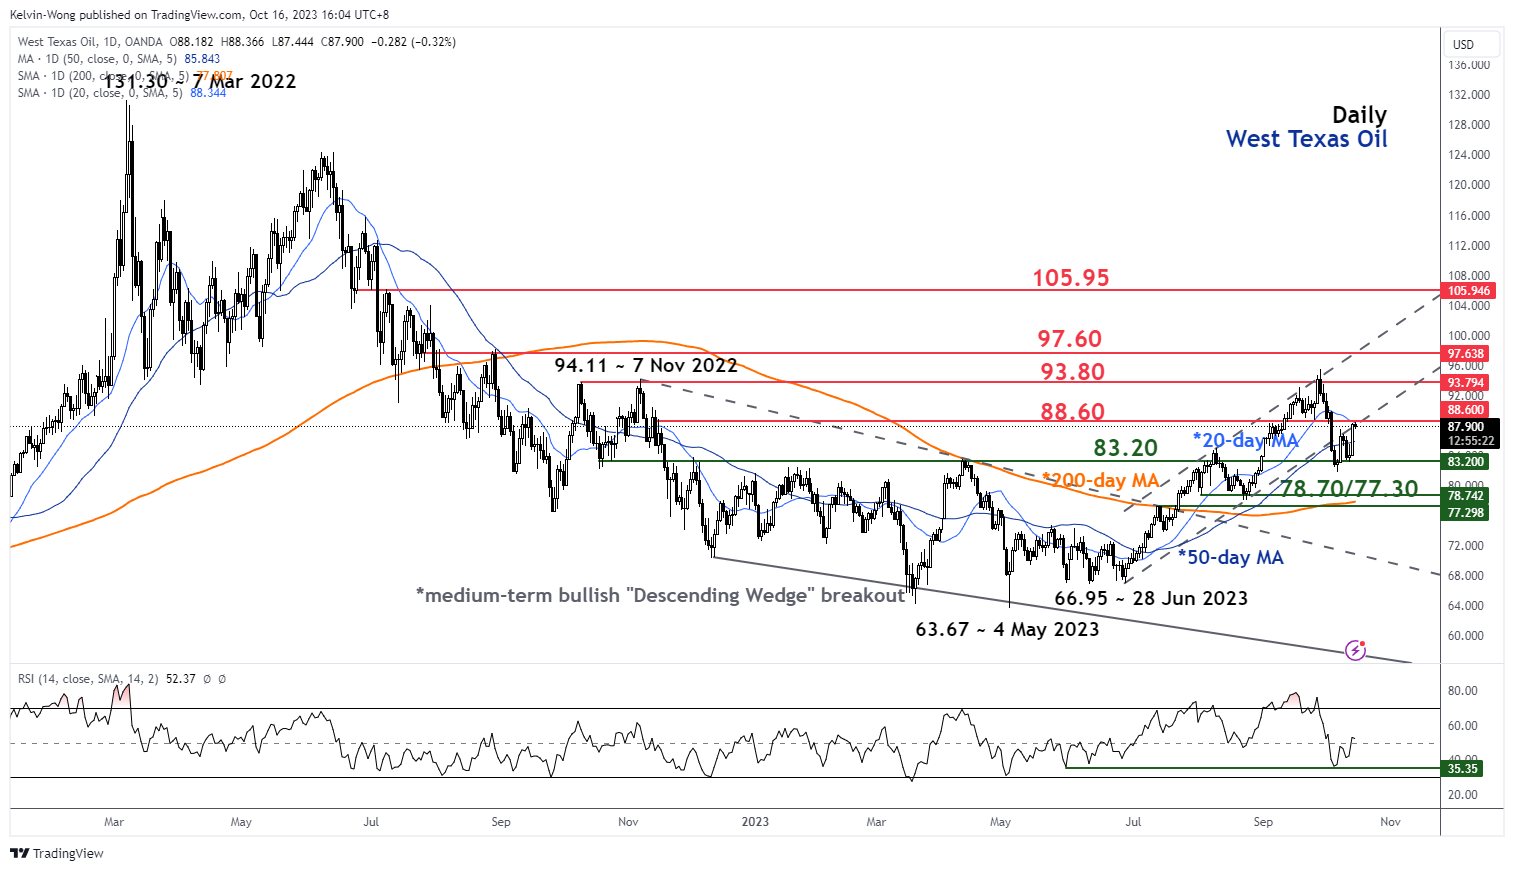
Fig 1: West Texas Oil medium-term trend as of 16 Oct 2023 (Source: TradingView, click to enlarge chart)
Throughout last Friday, 13 October session, the price actions of West Texas Oil (a proxy of WTI crude oil futures) remained on a bullish tone and ended the day with a daily bullish “Marubozu” reversal candlestick pattern.
In addition, the daily RSI momentum indicator has managed to tick higher above its 50 level which suggests a potential revival of medium-term bullish momentum.
May see a minor pull-back at this juncture before a new up move
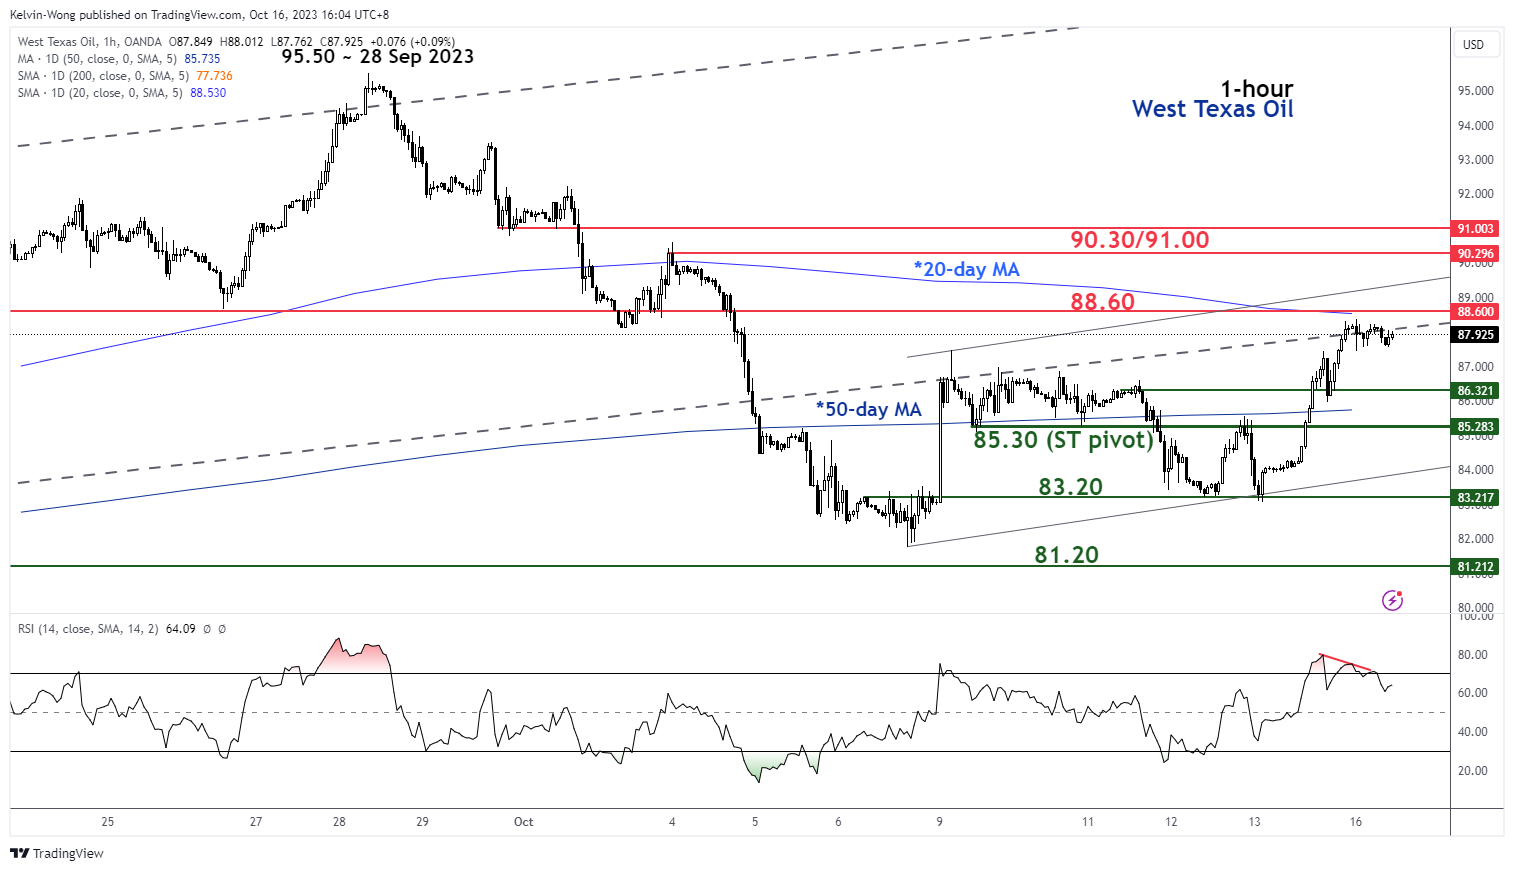
Fig 2: West Texas Oil minor short-term trend as of 16 Oct 2023 (Source: TradingView, click to enlarge chart)
In the lens of technical analysis, price actions of highly tradable instruments do not move in a vertical fashion but rather oscillate within a trend.
Last Friday’s strong upward movement has given rise to a short-term uptrend phase for West Texas Oil in place since the 6 October 2023 low of US$81.77/barrel.
However, the minor burst up in price actions has been overstretched and the hourly RSI oscillator has flashed out a bearish divergence condition right at the overbought region which suggests that West Texas Oil may see a pull-back first to retrace a certain portion of its up move from last Thursday, 12 October low of US$83.20/barrel to Friday, 13 October high of US$88.37/barrel before a new potential up move materializes.
Watch the US$85.30 key short-term support (also the 50-day moving average & the 61.8% Fibonacci retracement of the up move from the 12 October 2023 low to the 13 October 2023 high). A clearance above US$88.60 (20-day moving average) adds impetus for a further potential upside towards the next intermediate resistance of US$90.30/US$91.00 in the first step.
On the other hand, a break below US$85.30 negates the bullish tone for a deeper slide to retest US$83.20.
Content is for general information purposes only. It is not investment advice or a solution to buy or sell securities. Opinions are the authors; not necessarily that of OANDA Business Information & Services, Inc. or any of its affiliates, subsidiaries, officers or directors. If you would like to reproduce or redistribute any of the content found on MarketPulse, an award winning forex, commodities and global indices analysis and news site service produced by OANDA Business Information & Services, Inc., please access the RSS feed or contact us at info@marketpulse.com. Visit https://www.marketpulse.com/ to find out more about the beat of the global markets. © 2023 OANDA Business Information & Services Inc.

Kelvin Wong
Passionate about connecting the dots in the financial markets and sharing perspectives around trading and investment, Kelvin Wong is an expert in using a unique combination of fundamental and technical analyses, specializing in Elliott Wave and fund flow positioning, to pinpoint key reversal levels in the financial markets.
In addition, over the last ten years, Kelvin has conducted numerous market outlook and trading-related seminars, as well as technical analysis training courses, for thousands of retail traders.
Latest posts by Kelvin Wong (see all)
- Gold Technical: The recent sell-off may have reached a potential bullish reversal level at US$2,353 - 26 July 2024
- SPX 500: Further weakness may trigger a medium-term global risk-off event - 25 July 2024
- Nasdaq 100: Potential bullish reversal looms ahead of Alphabet and Tesla earnings results - 23 July 2024