Crude oil suffered the largest daily drop in more than a year yesterday despite stronger US labor market and manufacturing sector with lower Jobless Claims and higher than expected ISM Manufacturing number. Word on the street is that the decline was caused by tapering fears arising from the stronger economic numbers, but that assertion does not really fly when we remember that prices were actually rallying in the past 2 weeks after the Fed announced a surprise taper in its Dec FOMC meeting.
Hence, it is difficult to pin the decline on taper fears when actual tapering did not send crude prices lower. Instead, we should be pointing the finger at Crude’s underlying bearish sentiment that were identified yesterday following a lack lustre bullish response after the API numbers were announce. It is likely that bears lurking in the shadows took opportunity of the decline in Stocks and sell aggressively. Looking at various major USD pairs yesterday ( see AUD/USD, EUR/USD and GBP/USD), there are hints that proper trading has not returned from the holidays, and it is no wonder that bearish momentum was so strong even though bears were running on nothing but their own sentiment as there wasn’t enough volume to buffer this decline.
Weekly Chart
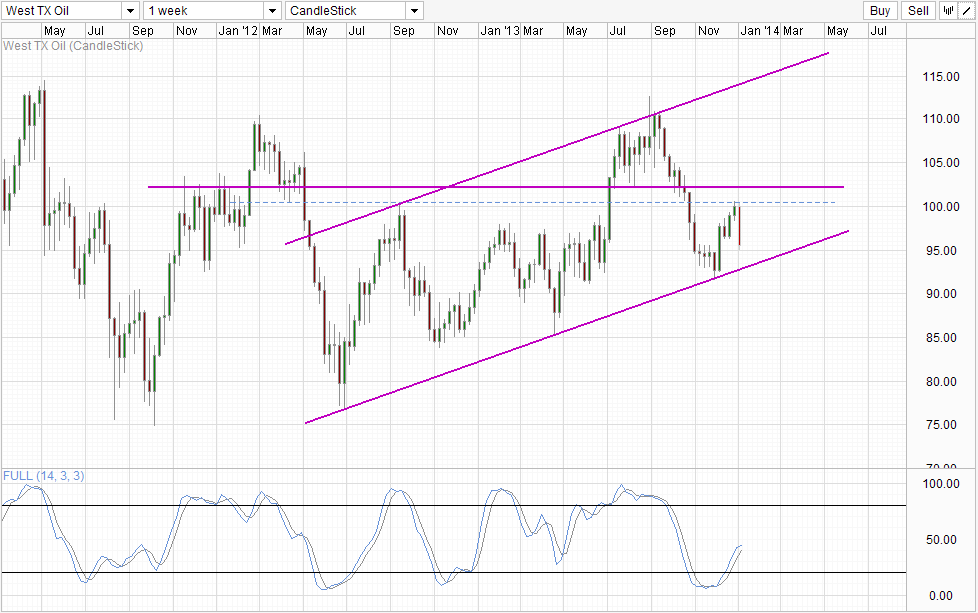
With that in mind, even if price manage to hit Channel Bottom today, it is unlikely that a bearish breakout will succeed without anything substantial to back the bears up. That being said, Stochastic indicator is open to a bearish reversal from here with Stoch curve tapering lower and may even reverse here ahead of the 50.0 “resistance” level. Then again, even if Channel Bottom is breached, price will likely find significant support around 90.0, by which Stochastic readings would already be in Oversold region. Hence, we need actual fundamental development changes moving forward in order for Crude to move all the way towards 75.0+ levels. Without which, we could see prices trending sideways between 90 – 95.0 which is where majority of 1H 2013 trading was.
Hourly Chart

Short-Term chart in this case isn’t very useful as it only shows that price has stabilized after the long slide down. Nonetheless, we can take reference from the soft ceiling of 95.5 and recent swing low of 95.0 to determine the next immediate short-term direction. Stochastic readings are pointing higher with a fresh bullish signal but “resistances” levels lie ahead. Hence a bullish pullback from here is not a cut and dry scenario and once again traders may be better off practising patience and wait for normal trading to resume.
More Links:
S&P 500 – Hangover from New Year as Price Decline On Profit Taking
This article is for general information purposes only. It is not investment advice or a solution to buy or sell securities. Opinions are the authors; not necessarily that of OANDA Corporation or any of its affiliates, subsidiaries, officers or directors. Leveraged trading is high risk and not suitable for all. You could lose all of your deposited funds.

Mingze Wu
Latest posts by Mingze Wu (see all)
- European Bourses Not Enjoying Bullish Winds From US Stocks - 17 April 2014
- More Aggressive Stimulus Possible Despite Premier Li’s Denial - 17 April 2014
- China March FDI -1.5% Y/Y vs +2.05% expected. First decline in more than a year. - 16 April 2014