- Spot Gold (XAU/USD) minor corrective pull-back of -3.8% from the 27 October 2023 high to 13 November 2023 low may have ended.
- Potential start of another multi-week bullish up move for Spot Gold (XAU/USD).
- A further slide in the 10-year US Treasury real yield supports a bullish narrative for Gold.
- Watch the key short-term support at US$1,972.
This is a follow-up analysis of our prior report, “Gold Technical: At the risk of further corrective decline before potential recovery” published on 9 November 2023. Click here for a recap.
Spot Gold (XAU/USD) has indeed shaped the corrective decline from its key short-term resistance of US$1,972 mentioned in our report and hit the US$1,932/1,920 support zone (printed an intraday low of US$1,931) on last Monday, 13 November.
Thereafter, the price actions of Gold (XAU/USD) have shaped a strong bullish reversal movement which in turn increases the odds that the corrective decline of -3.8% from the 27 October 2023 high of US$2,009 to 13 November 2023 low may have ended.
Several key technical elements and Intermarket analysis now suggest the Gold (XAU/USD) is likely undergoing another potential multi-week impulsive upmove sequence to retest its current all-time high of US$2,075 in the first step.
Lower opportunity cost of holding Gold
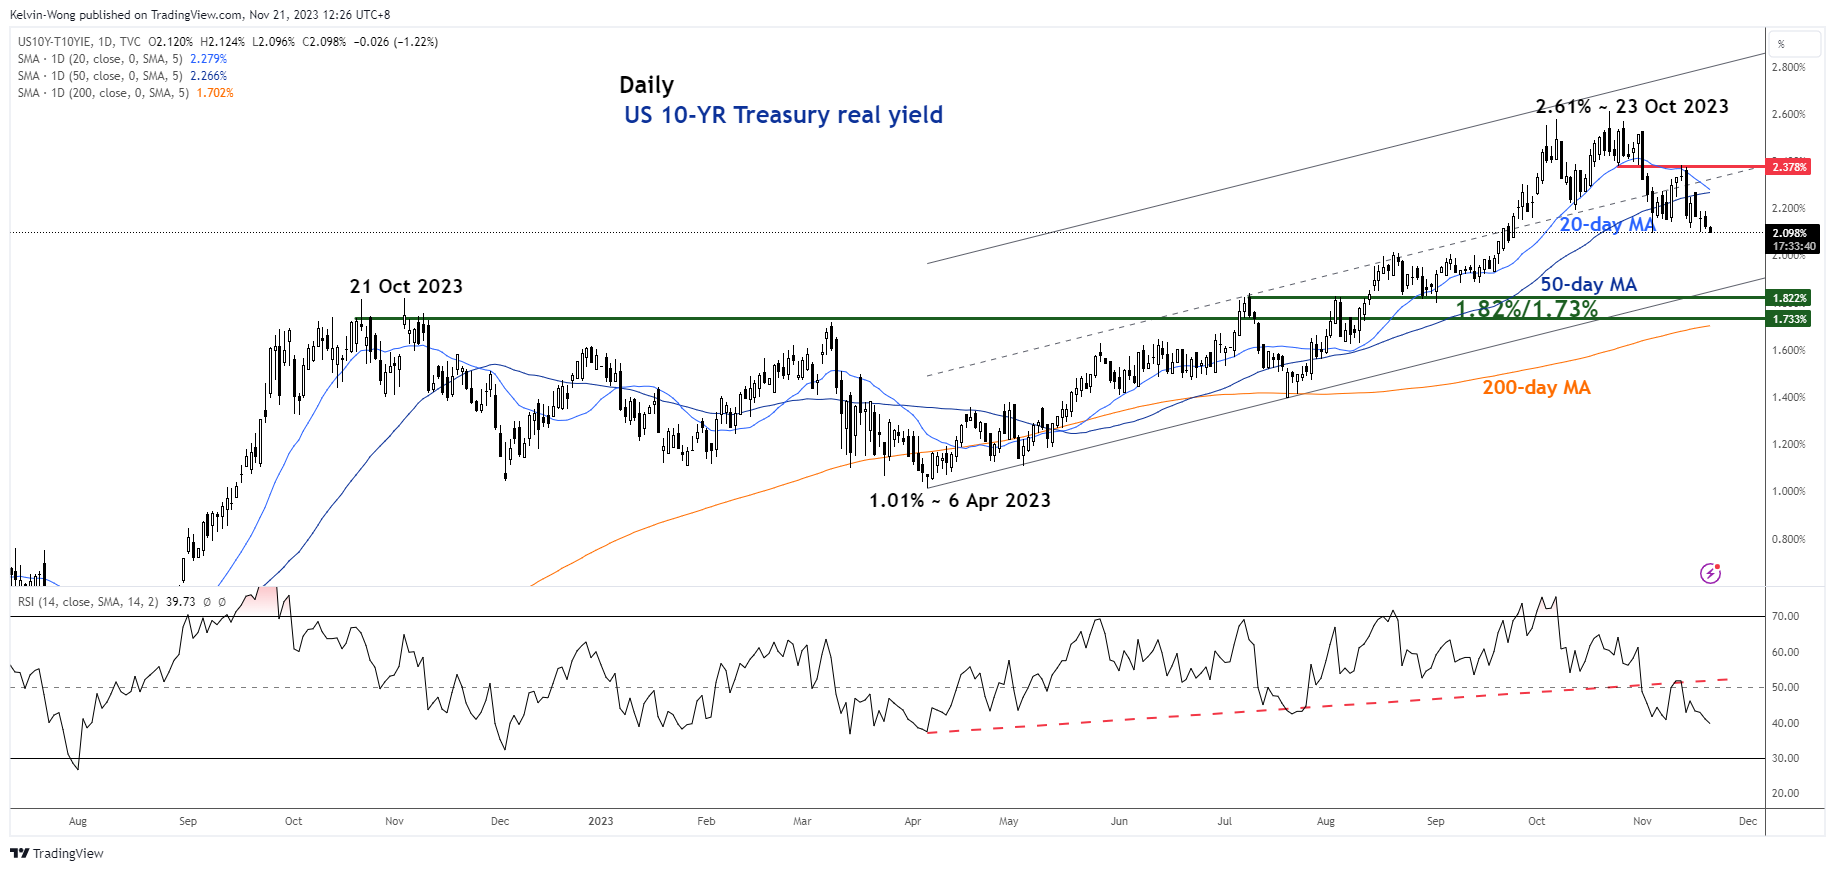
Fig 1: US 10-year Treasury real yield medium-term trend as of 21 Nov 2023 (Source: TradingView, click to enlarge chart)
The 10-year US Treasury real yield has shed -50 basis points (bps) from its 23 October 2023 high of 2.61% to yesterday, 20 November low of 2.11%; its steepest decline since the period of 9 March 2023 to 6 April 2023.
Technically speaking, medium-term momentum has turned bearish for the 10-year US Treasury real yield which increases the odds of a further slide at this juncture toward the long-term pivotal support zone of 1.82%/1.73% (also the lower boundary of the ascending channel from 6 April 2023 low & the 200-day moving average).
Hence, a further slide in the longer-term US Treasury real yield implies a lower opportunity cost of holding Gold as it is a non-interest bearing which in turn may increase its “relative attractiveness” and drive-up demand.
Bullish reversal after a retest on key 200-day moving average
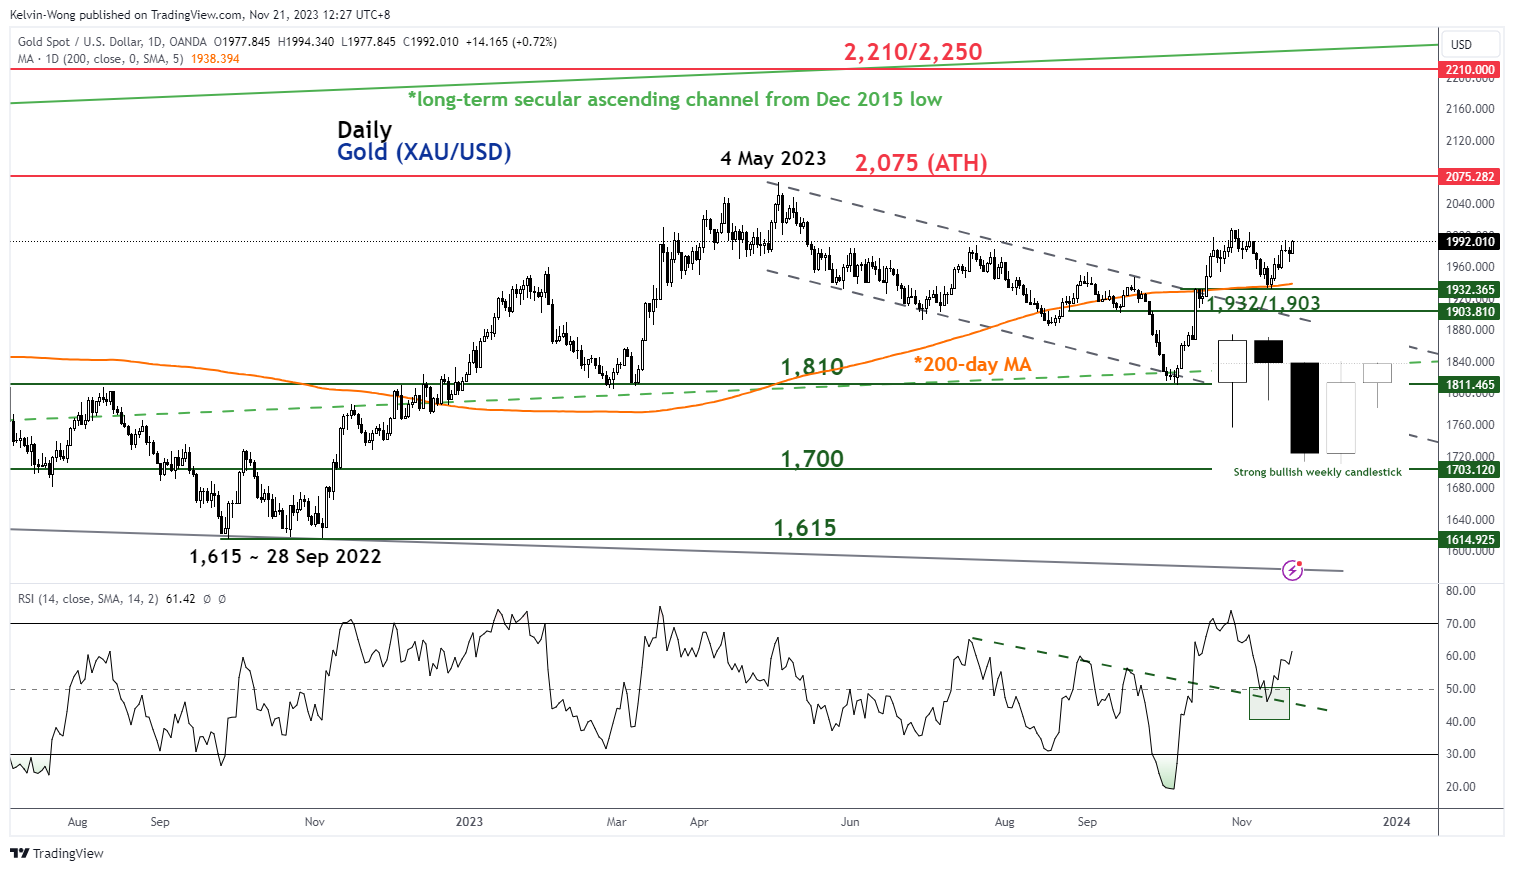
Fig 2: Spot Gold (XAU/USD) medium-term trend as of 21 Nov 2023 (Source: TradingView, click to enlarge chart)
The price actions of Gold (XAU/USD) have shaped a strong weekly bullish candlestick last week that closed more than 50% of the long bearish Marubozu weekly candlestick for the week of 6 November 2023.
In addition, the daily RSI momentum has staged a rebound from its 50 level, indicating a revival of medium-term bullish momentum.
These observations suggest a significant change of sentiment from bearish to bullish that in turn advocates a potential terminal end to its short-term minor corrective decline from 27 October 2023 to 13 November 2023.
Watch the key short-term support at US$1,972
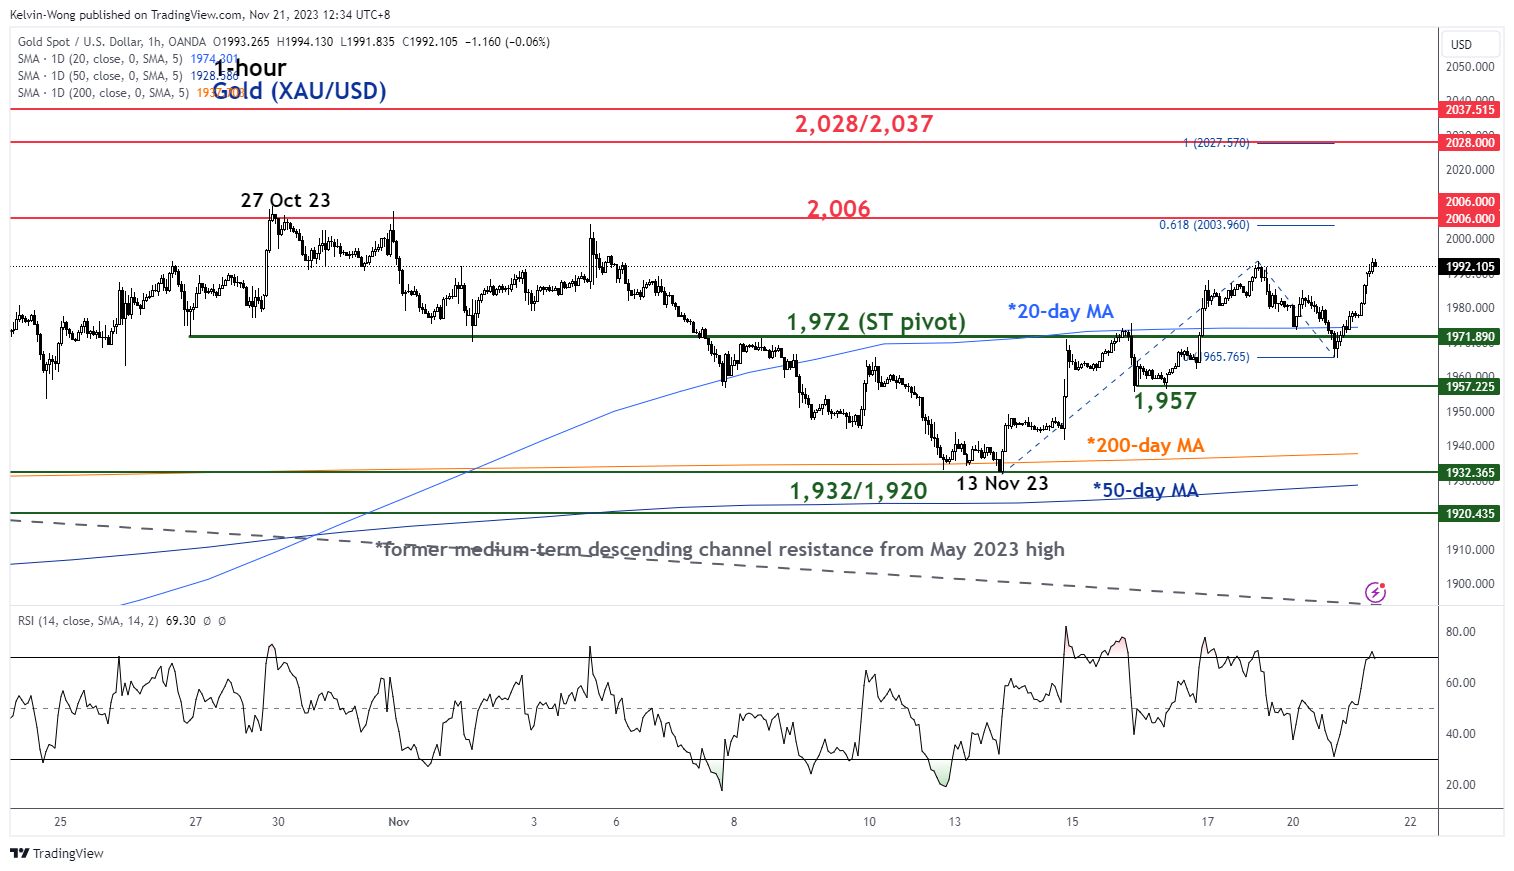
Fig 3: Spot Gold (XAU/USD) minor short-term trend as of 21 Nov 2023 (Source: TradingView, click to enlarge chart)
Yesterday’s price actions of Gold (XAU/USD) have shaped a minor pull-back of -1.4% from last Friday, 17 November high of US$1,993 before it staged a bullish reversal right at its 20-day moving average.
If the US$1,972 key short-term pivotal support holds, the minor short-term uptrend from the 13 November 2023 low remains intact. The next immediate resistances to watch will be at US$2,006 and US$2,028/US$2,037 (minor swing high area of 11 May 2023 & Fibonacci extension from 13 November 2023 low).
However, a break below US$1,972 negates the bullish tone for a pull-back towards the US$1,957 intermediate support.
Content is for general information purposes only. It is not investment advice or a solution to buy or sell securities. Opinions are the authors; not necessarily that of OANDA Business Information & Services, Inc. or any of its affiliates, subsidiaries, officers or directors. If you would like to reproduce or redistribute any of the content found on MarketPulse, an award winning forex, commodities and global indices analysis and news site service produced by OANDA Business Information & Services, Inc., please access the RSS feed or contact us at info@marketpulse.com. Visit https://www.marketpulse.com/ to find out more about the beat of the global markets. © 2023 OANDA Business Information & Services Inc.

Kelvin Wong
Passionate about connecting the dots in the financial markets and sharing perspectives around trading and investment, Kelvin Wong is an expert in using a unique combination of fundamental and technical analyses, specializing in Elliott Wave and fund flow positioning, to pinpoint key reversal levels in the financial markets.
In addition, over the last ten years, Kelvin has conducted numerous market outlook and trading-related seminars, as well as technical analysis training courses, for thousands of retail traders.
Latest posts by Kelvin Wong (see all)
- Gold Technical: The recent sell-off may have reached a potential bullish reversal level at US$2,353 - 26 July 2024
- SPX 500: Further weakness may trigger a medium-term global risk-off event - 25 July 2024
- Nasdaq 100: Potential bullish reversal looms ahead of Alphabet and Tesla earnings results - 23 July 2024