- Lofty dovish expectations of 4 Fed funds rate cut in 2024 are at risk of being dialed back.
- Short-term bullish momentum has resurfaced in the US 10-year Treasury real yield.
- Spot Gold (XAU/USD) may continue its short-term corrective decline sequence.
- Watch the key short-term resistance at US$2,040 on Spot Gold (XAU/USD).
This is a follow-up analysis of our prior report, “Gold Technical: Medium-term uptrend remains intact but risk of minor pull-back” published on 4 December 2023. Click here for a recap.”
Spot Gold (XAU/USD) has shaped the expected pull-back towards the short-term support levels of US$2,032/2,018 and US$2,006 highlighted in our prior analysis from its intraday all-time high of US$2,149 printed last Monday, 4 December.
Also, Spot Gold (XAU/USD) recorded its worst weekly loss of -3.26% since the week of 25 September 2023 on the backdrop of better-than-expected US non-farm payrolls data for November (+199,000 above consensus +180,000, and +150,000 recorded in October).
The monthly growth of the number of jobs added in the US labour market has continued to tread lower for the second consecutive month and below the 12-month average monthly gain of 240,000. But its slowdown is not as severe as expected in November as the unemployment rate also dipped to 3.7% from 3.9% in October.
All in all, the US labour market is still indicating a soft-landing scenario for the US economy which in turn may force market participants to reduce their current lofty dovish expectations on the trajectory of Fed funds rate for 2024 with a total of four cuts at 100 basis points (bps) based on the current Fed funds interest rate futures data as calculated by the CME FedWatch Tool. Also, it is twice the amount of rate cuts projected in 2024 as indicated by the last Fed officials’ dot plot forecasts released in September’s FOMC meeting.
Considering the risk of a downward adjustment in expectations to the current heightened level of optimism on the amount of Fed funds rate cuts for 2024, it may unleash a minor rebound scenario in the US 10-year Treasury real yield that in turn puts further potential downside pressure for Spot Gold in the short-term via the conduit of “higher opportunity costs”.
US 10-year Treasury real yield has almost reached a major support zone
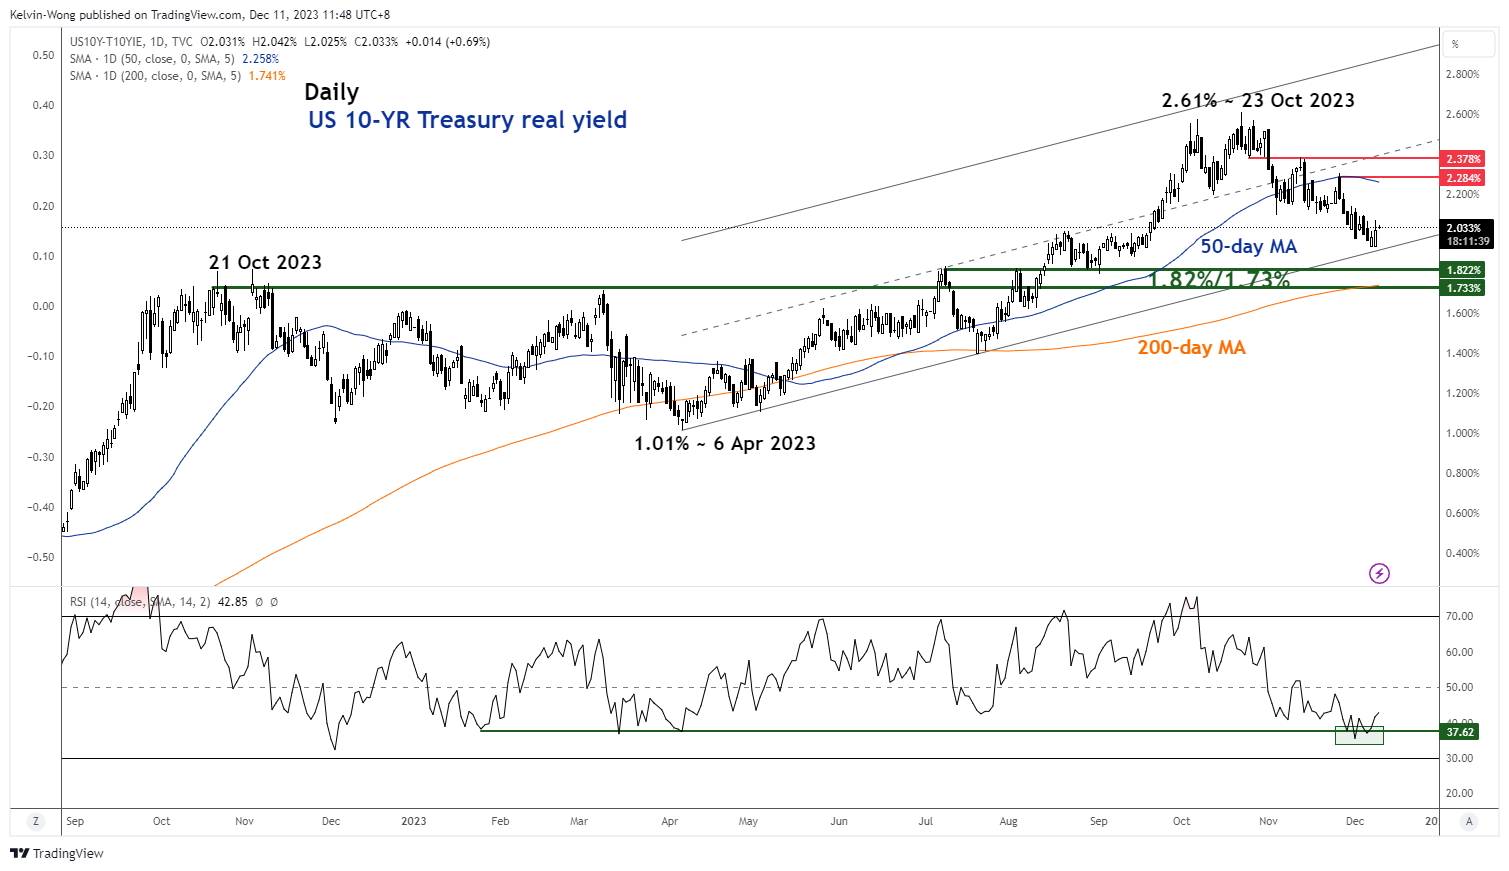
Fig 1: US 10-year Treasury real yield medium-term trend as of 11 Dec 2023 (Source: TradingView, click to enlarge chart)
The recent two-month decline of -68 bps from its 23 October 2023 high of 2.61% to last Thursday, 7 December low of 1.93% has reached the lower boundary of a medium-term ascending channel in place since 6 April 2023 and right above the major support zone of 1.82%/1.73%.
In addition, the daily RSI momentum indicator has tested and rebounded from a parallel support at the 37 level which suggests that the current medium-term downside momentum has abated.
2.28%/2.38% is the intermediate resistance zone (also the 50-day moving average) to watch on the US 10-year Treasury real yield.
Gold is on potential track to retest its 200-day moving average
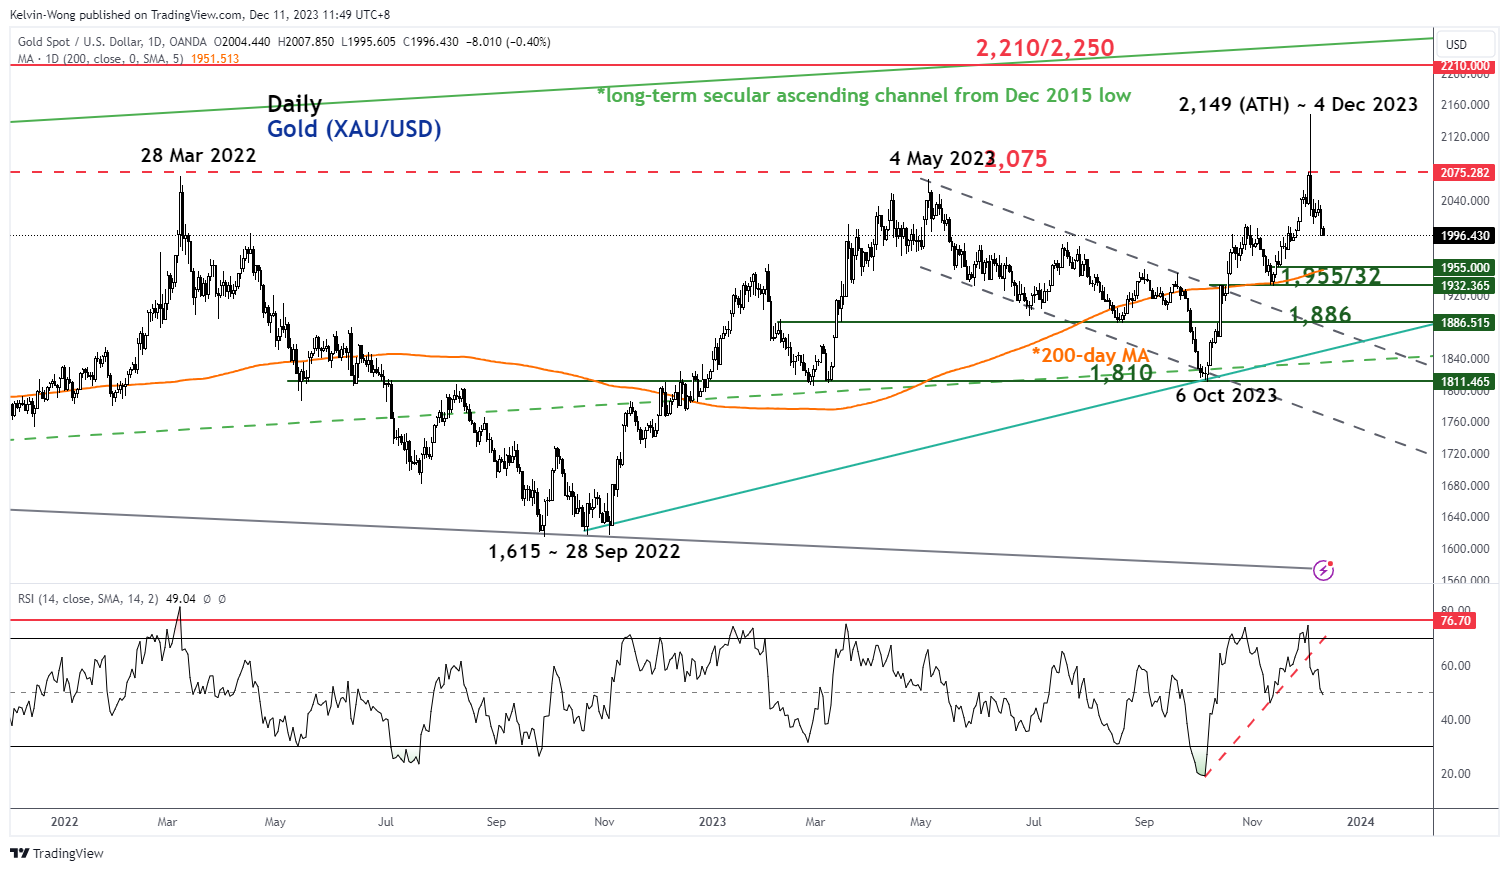
Fig 2: Spot Gold (XAU/USD) medium-term trend as of 11 Dec 2023 (Source: TradingView, click to enlarge chart)
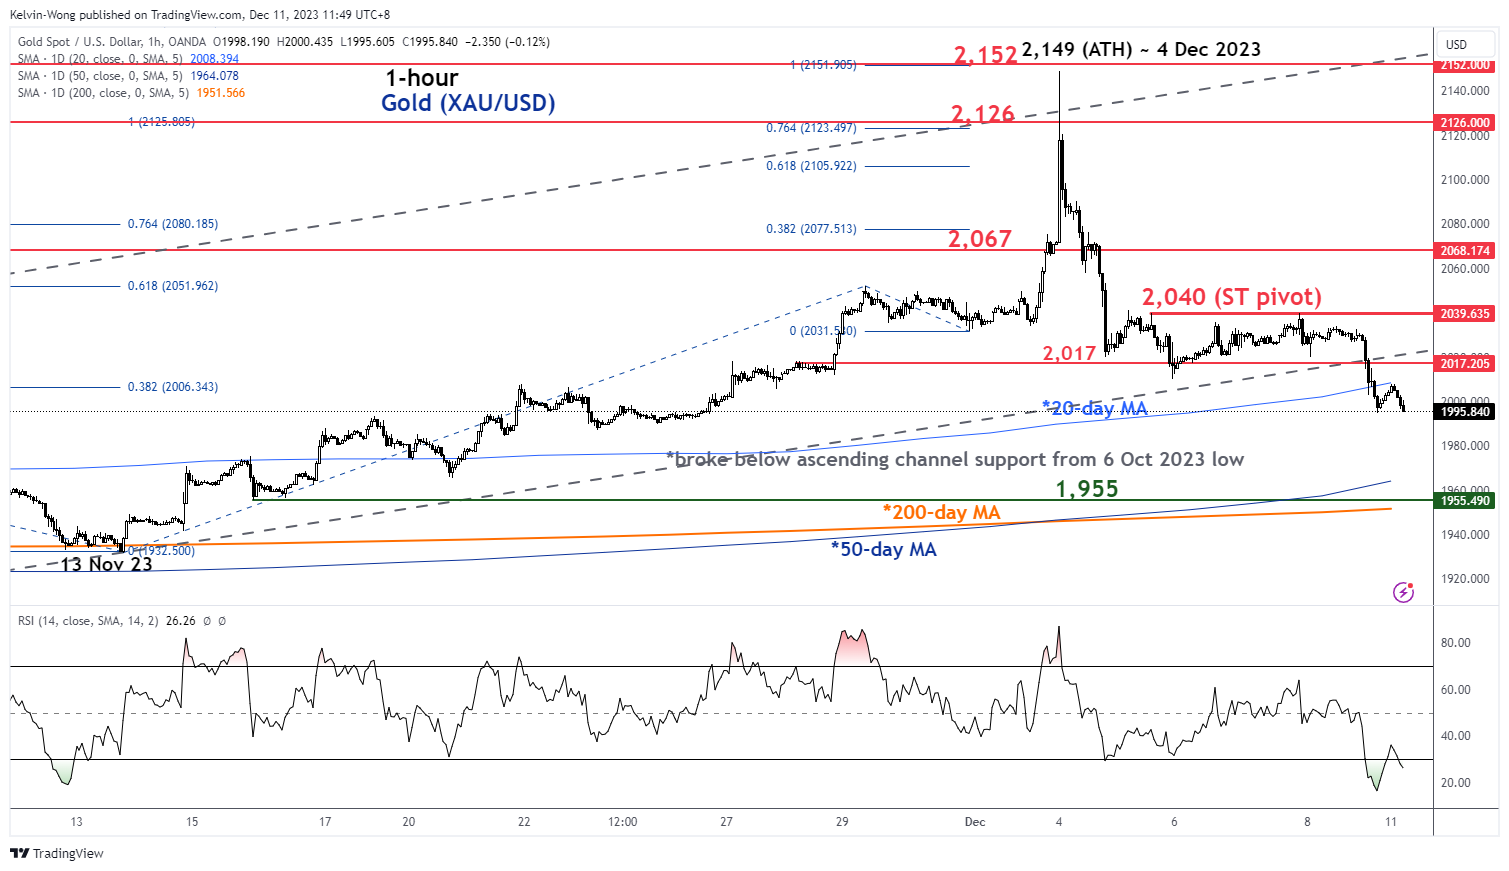
Fig 3: Spot Gold (XAU/USD) minor short-term trend as of 11 Dec 2023 (Source: TradingView, click to enlarge chart)
The price actions of spot Gold (XAU/USD) have broken below its 20-day moving average and the ascending channel support from its 6 October 2023 low of US$1,810 suggests the minor corrective decline from last Monday, 4 December all-time high of US$2,149 is likely to extend within its medium-term uptrend phase.
In addition, the hourly RSI momentum indicator has not flashed any bullish divergence condition at its oversold region after last Friday’s slide in price actions. These observations suggest that short-term bearish momentum is likely to be intact.
If the US$2,040 key short-term pivotal resistance is not surpassed, Spot Gold (XAU/USD) may see its medium-term support coming in at US$1,955 (confluences closely with the 50 and 200-day moving averages).
However, a clearance above US$2,040 may put the bulls back in control with the next intermediate resistance to watch at US2,067 followed by US2,126 next.
Content is for general information purposes only. It is not investment advice or a solution to buy or sell securities. Opinions are the authors; not necessarily that of OANDA Business Information & Services, Inc. or any of its affiliates, subsidiaries, officers or directors. If you would like to reproduce or redistribute any of the content found on MarketPulse, an award winning forex, commodities and global indices analysis and news site service produced by OANDA Business Information & Services, Inc., please access the RSS feed or contact us at info@marketpulse.com. Visit https://www.marketpulse.com/ to find out more about the beat of the global markets. © 2023 OANDA Business Information & Services Inc.

Kelvin Wong
Passionate about connecting the dots in the financial markets and sharing perspectives around trading and investment, Kelvin Wong is an expert in using a unique combination of fundamental and technical analyses, specializing in Elliott Wave and fund flow positioning, to pinpoint key reversal levels in the financial markets.
In addition, over the last ten years, Kelvin has conducted numerous market outlook and trading-related seminars, as well as technical analysis training courses, for thousands of retail traders.
Latest posts by Kelvin Wong (see all)
- Gold Technical: The recent sell-off may have reached a potential bullish reversal level at US$2,353 - 26 July 2024
- SPX 500: Further weakness may trigger a medium-term global risk-off event - 25 July 2024
- Nasdaq 100: Potential bullish reversal looms ahead of Alphabet and Tesla earnings results - 23 July 2024