Crude Oil prices traded higher yesterday on stronger than expected data from DOE. Crude Inventory for the week of 10th Jan decreased by 7.66 million barrels, almost 6 times as much as analysts’ consensus estimate which was at 1.3 million. This is also much higher than the numbers compiled by American Petroleum Institute, which estimated a fall of 4.14 million barrels. Perhaps even more significant was the fact that last week’s decline in inventory is higher than that of the preceding week, suggesting that the pace of rising implied demand isn’t going to end soon.
2 Hourly Chart

Prices rose to a high of 94.6 following the news release, with prices starting to pullback when it’s clear that the resistance level is not going to go away. This decline continued well into the Asian session, dragged lower by the bearish sentiment evident from Asian stocks this morning. Currently, price is heading back towards 93.3 support and confluence with rising trendline. Stochastic readings concurs with this bearish outlook as Stoch curve is currently pointing lower with a fresh bearish cycle signal looking likely to be formed in the upcoming candle or the next. However, price should ideally break below 94.0 – 94.1 (the ceiling back between 7th to 8th Jan) in order to demonstrate strong bearish conviction which will match with the emergence of a proper bearish cycle signal.
It should also be noted that Crude prices are also inherently bullish with prices actually accelerating higher and breaking the 93.3 resistance even before the DOE numbers were released. This can be attributed to the overall bullish risk appetite during the European/early US session pushing risk correlated assets higher. With this in mind, S&P 500 Futures currently is pushing lower and may even break the 1,845 support level. Should risk appetite remain bearish, the likelihood of a 93.3 test increases.
Daily Chart
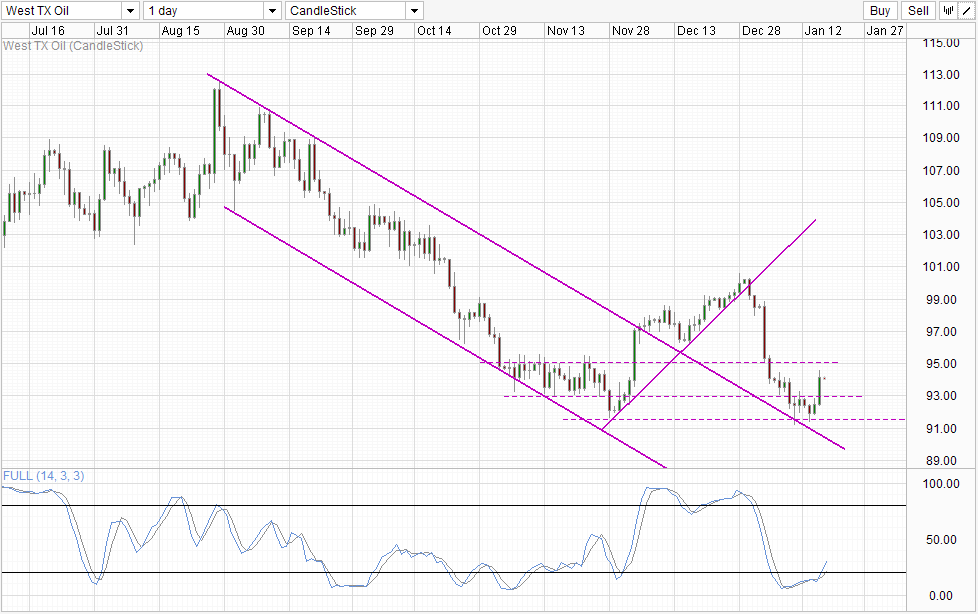
Daily Chart is less bearish than before with prices entering the 93.0 – 95.0 consolidation zone. However, overall bearish pressure remain, and even if price manage to recover and push higher from here, it is unlikely that 95.0 resistance will be broken and even should the unlikely happen, 96.0 and 97.0 will stand ready to keep rallies in check. Stochastic readings have given us a bullish cycle signal now, but even that may not take us far as Stoch curve has its own “resistances” to take care of, and a full bullish cycle from here out will be a difficult task to say the least.
More Links:
GBP/USD – Drops Back to Support Level of 1.6350
AUD/USD – Returns to Familiar Territory Below Resistance Level of 0.90
EUR/USD – Eases Away from Resistance Level at 1.37
This article is for general information purposes only. It is not investment advice or a solution to buy or sell securities. Opinions are the authors; not necessarily that of OANDA Corporation or any of its affiliates, subsidiaries, officers or directors. Leveraged trading is high risk and not suitable for all. You could lose all of your deposited funds.

Mingze Wu
Latest posts by Mingze Wu (see all)
- European Bourses Not Enjoying Bullish Winds From US Stocks - 17 April 2014
- More Aggressive Stimulus Possible Despite Premier Li’s Denial - 17 April 2014
- China March FDI -1.5% Y/Y vs +2.05% expected. First decline in more than a year. - 16 April 2014