Crude Oil rallied from a low of 105.5 yesterday to a high of 108.87 in 24 hours thanks to 2 major fundamental push. First to come in was the stronger than expected implied demand reflected by the Department of Energy weekly report. Crude Oil Inventories decreased by 4.4 million barrels in the week of 13 September versus an expected 1.2 million decline. This is the 1st time in 6 weeks where the actual Crude Inventory change is more negative than expected, resulting in a strong recovery in prices. Implied demand for Distillate and Gasoline are also better than expected, further fueling prices higher. FOMC meeting provided yet more bullish fuel thanks to Bernanke’s non-tapering surprise. This increase in risk appetite sent prices sharply higher once again, giving Oil an almost 3 dollar gain within the US session.
Hourly Chart
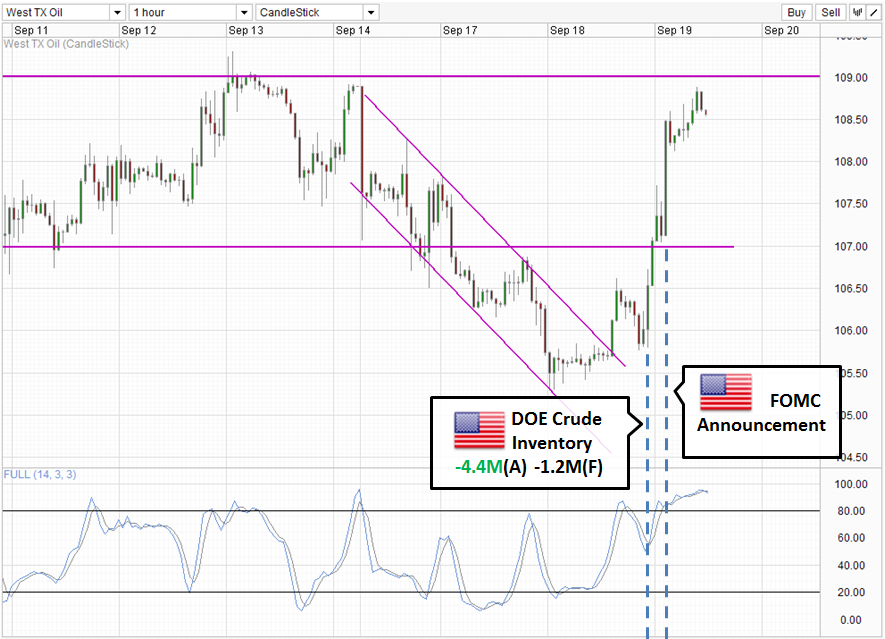
However, from a technical perspective, it is hard to pronounce that Crude is on a bullish uptrend. This is because price seems to be faltering at every conceivable resistances after rallying, suggesting that there isn’t really a true bullish sentiment, but rather knee jerk reaction to the better than expected economic news. Case in point, the rally post DOE numbers resulted in price backing off the 107.5 resistance, and it was only thanks to the FOMC turnout that resulted in price able to push higher. Even right now, price remains below the 109.0 round figure and ceiling of 13th September, and there is a niggling suspicion that price may fail to break it without anymore fundamental push considering that we’re already heavily overbought as indicated by Stochastic.
That being said, it should be noted that Crude Oil actually performed slightly better than US stocks, wherein prices managed to climb above the post FOMC announcement immediate high, with risk appetite in Asian markets able to drag prices higher. Hence it should not be automatically assumed that price will fall from here. Ideally, price should break below 108.20 and preferably 108.0 and coincide with a Stoch break of 80.0 to initiate a move towards 105+ regions again, with 107 providing interim support.
Weekly Chart
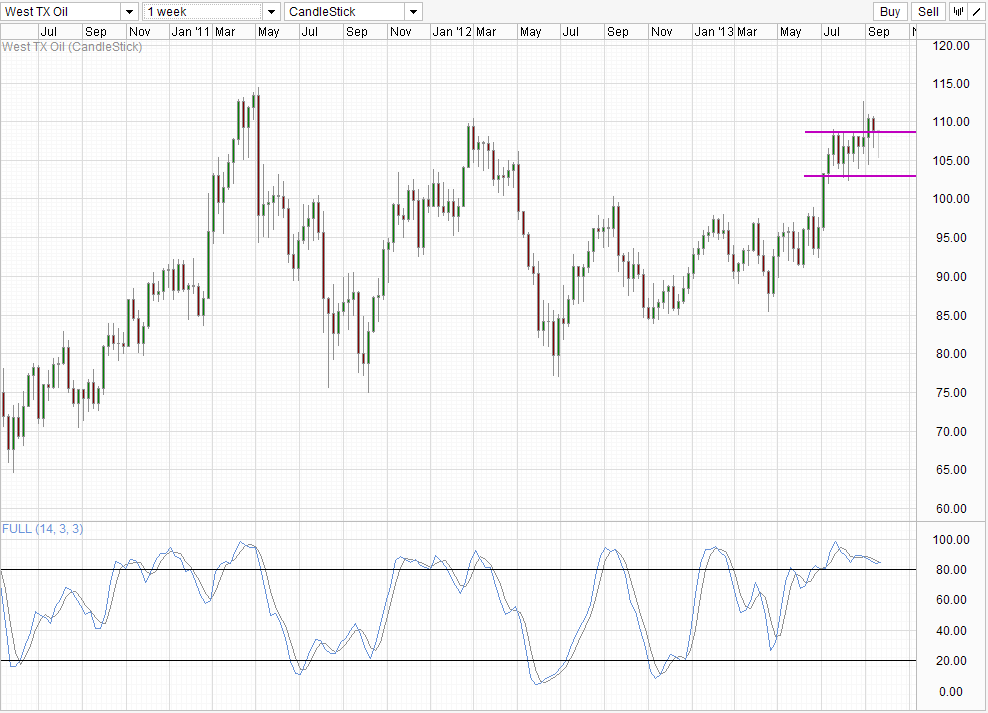
Weekly Chart is slightly bullish as price is trading above the 108.50 ceiling. But it should be noted that 108.5 is just a mere reference, and shouldn’t be regarded as the line in the sand that separates between bullish/bearishness. In fact, you could possibly draw the line at 109.0 and perhaps even extend it to 110.0 and the result will still be the same. Hence, confirmation is definitely needed for either side as current levels are within historical topping regions.
More Links:
GBP/USD – Surges to Eight Month High above 1.61
AUD/USD – Surges to Three Month High above 0.95
EUR/USD – Surges to Seven Month High above 1.35
This article is for general information purposes only. It is not investment advice or a solution to buy or sell securities. Opinions are the authors; not necessarily that of OANDA Corporation or any of its affiliates, subsidiaries, officers or directors. Leveraged trading is high risk and not suitable for all. You could lose all of your deposited funds.

Mingze Wu
Latest posts by Mingze Wu (see all)
- European Bourses Not Enjoying Bullish Winds From US Stocks - 17 April 2014
- More Aggressive Stimulus Possible Despite Premier Li’s Denial - 17 April 2014
- China March FDI -1.5% Y/Y vs +2.05% expected. First decline in more than a year. - 16 April 2014