Crude Oil continue to trade sideways after breaking 100.50. Price rallied due to the unrest in Egypt earlier on, but since the ousting of ex-President Morsi and the installation of an interim leader Mansour, the situation has defused greatly, providing no more reason for price to head higher. Furthermore, with US market closing due to Independence Day celebrations, trading activity in Crude Oil fell significantly. Today was no difference, with low activities as traders choosing not to enter heavy bets ahead of the major NFP event risk.
Hourly Chart
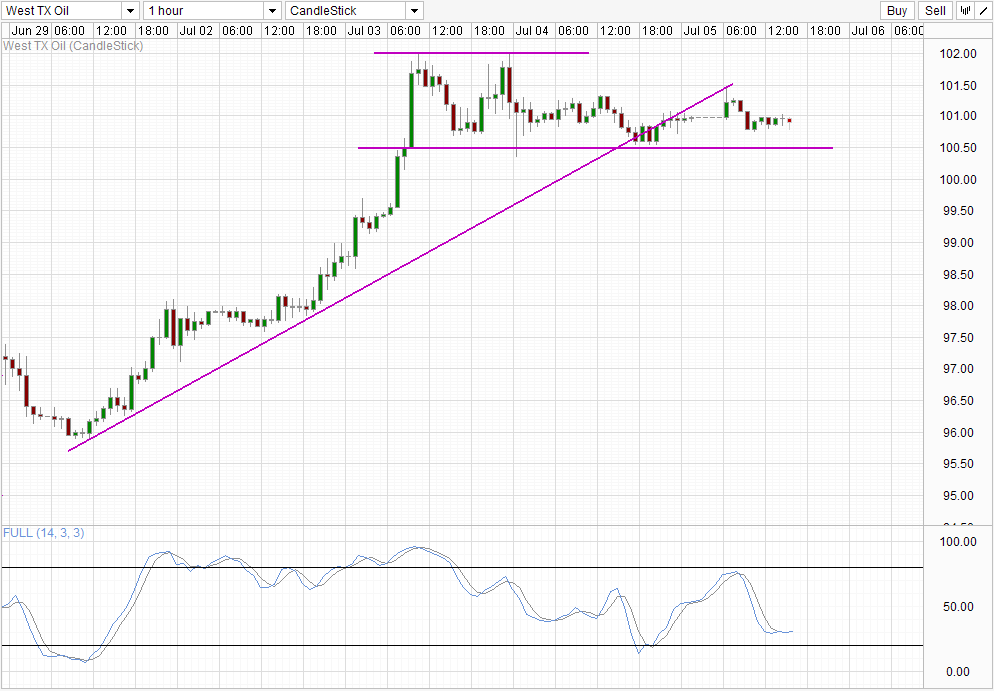
From a technical perspective, current price is actually slightly bearish as price has broken away from the rising trendline. Couple that with the fact that price didn’t really produce a strong bullish showing following Wednesday’s surprisingly bullish DOE Inventory numbers, we are looking at a bullish momentum that is obviously deflating. However, it is also clear that bears are not trying to wrestle control, with Stochastic readings merely flattening out instead of heading lower, reflected by the fact that price didn’t test 100.5 in any significant manner whatsoever since Wednesday. Hence given the slowing bullish momentum and the lack of bearish momentum, price is basically trading in limbo and going nowhere.
It is possible that NFP numbers may be able to inject some volatility back. However, Crude Oil is notoriously immune by NFP numbers. If there is going to be any reaction post NFP, it would more likely come from the USD volatility that arose rather than demand of crude increasing or falling based on the US economic outlook. Hence if we see Crude moving in a clear direction tonight, we may see similar direction from USD currency pairs and other commodities as well – especially Gold.
Weekly Chart
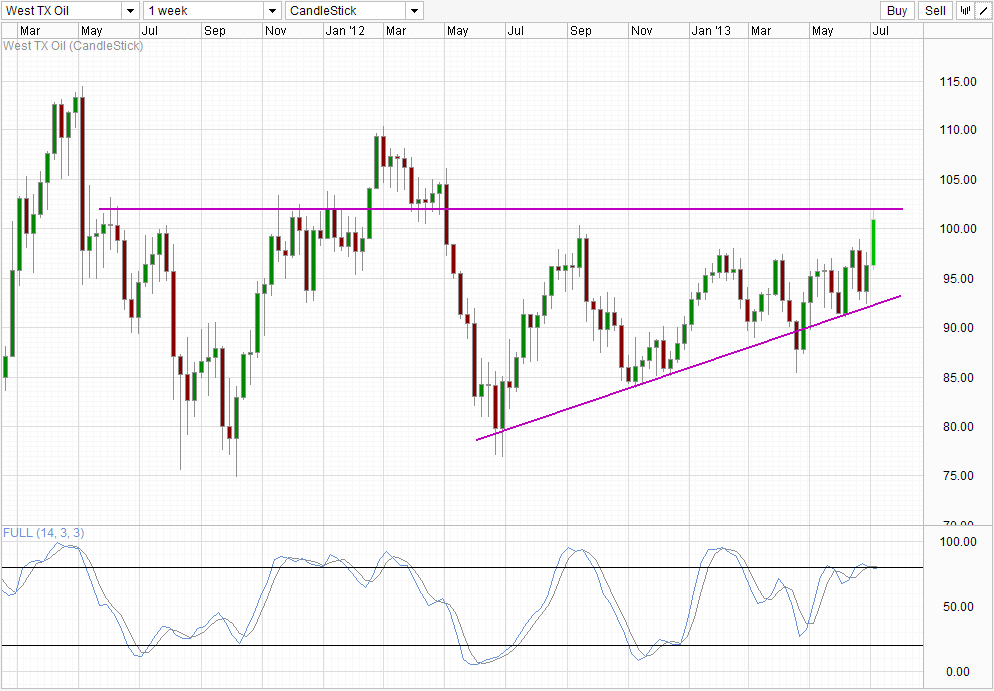
From a longer-term perspective, the recent rally is currently facing the 102.0 ceiling, which provide the possibility of a rebound lower towards the rising trendline should price fail to break it. Stochastic readings suggest that a top may be in place, with Stoch/Signal lines currently pointing sideways and could easily head lower should 102.0 holds. However, currently there is no evidence of a rebound from price action, which means that the rally from June 2012 lows is still in play. That being said, there is possibility of price breaking above the 102.0 level due to volatility arising from NFP, as such traders should also be mindful about potential fakeouts, especially since 102.0 is not a hard ceiling, with candle shadows extending all the way to 103.0 when the level was acting as the ceiling, and around 101.0 when it was acting as a floor.
Therefore, conservative traders may wish to keep a lookout on Monday’s price action, and see any confirmation of bullish/bearish movement during early trade to determine the market’s sentiment. This is by no means a sure fire method, but it does provide an additional confirmation to what we think technicals are telling us after tonight.
More Links:
Nikkei 225: Approaching 14,450 before US NFP
NZD/USD Technicals – Trading back up within Support Zone
US Market Roundup: Futures Higher on European Optimism, NFP looming
This article is for general information purposes only. It is not investment advice or a solution to buy or sell securities. Opinions are the authors; not necessarily that of OANDA Corporation or any of its affiliates, subsidiaries, officers or directors. Leveraged trading is high risk and not suitable for all. You could lose all of your deposited funds.

Mingze Wu
Latest posts by Mingze Wu (see all)
- European Bourses Not Enjoying Bullish Winds From US Stocks - 17 April 2014
- More Aggressive Stimulus Possible Despite Premier Li’s Denial - 17 April 2014
- China March FDI -1.5% Y/Y vs +2.05% expected. First decline in more than a year. - 16 April 2014