The Kiwi dollar has fallen on hard times recently after RBNZ Governor Wheeler revealed that the Central Bank was actively intervening in the secondary markets in order to bring NZD down. Wheeler also threatened to embark on rate cuts as soon as possible once the conditions are right for good measure, sending NZD/USD to one of the fiercest tumble since May 2012.
Since then however, price has recovered significantly, with price action forming a “spinning top” candlestick pattern, negating the possibility for a 3 Black Crows pattern similar to what happened last year. This underlines the underlying bull strength, and keeps the rally since Jun 2012 intact. However, to say that price will be able to bounce higher and continue the uptrend is speculative at best, especially with 0.818 acting as resistance and the descending trendline looming above.
Weekly Chart
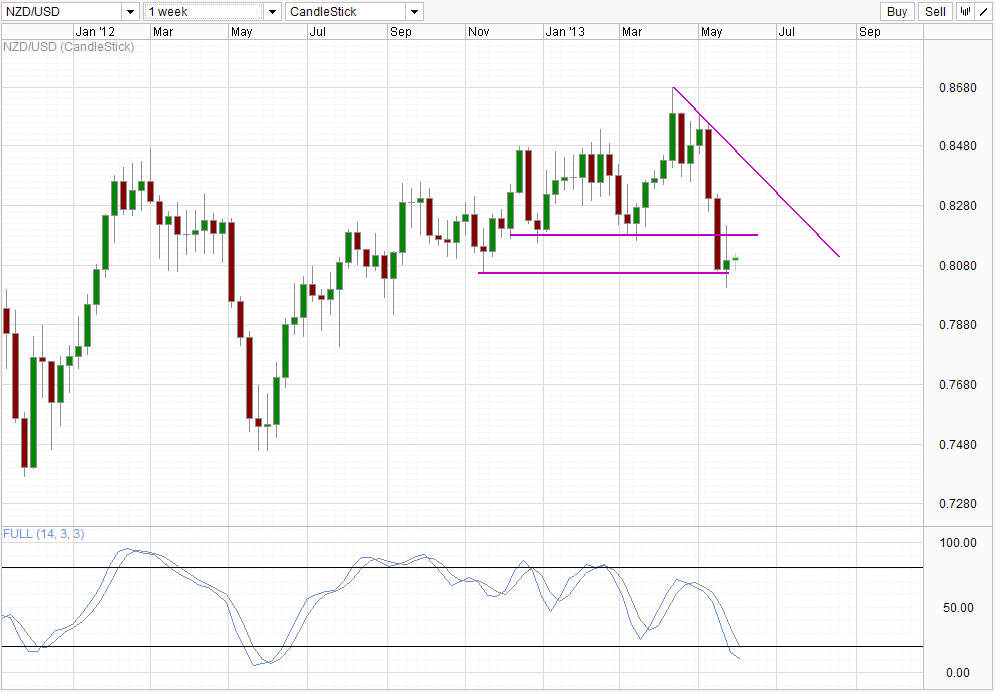
That being said, it is highly likely that selling activity will slow down from here. Stoch readings are flattening with the Signal line entering the Oversold region. Current Stoch level is also around the same as the previous trough back in May 2012. If history repeats itself once more, a bullish recovery will not be surprising from here.
Hourly Chart
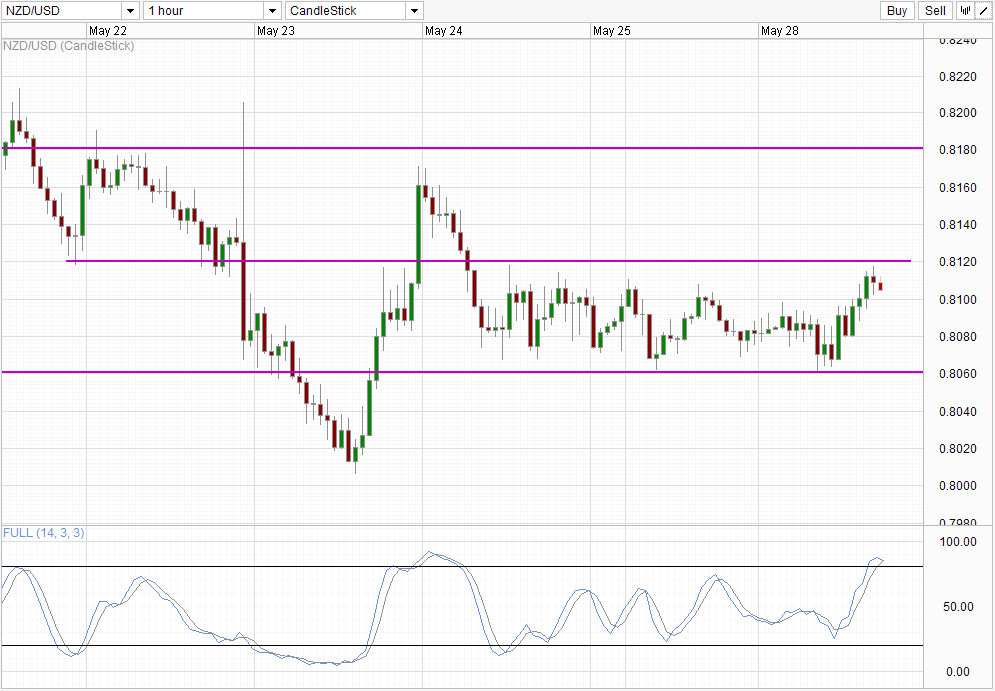
From the hourly chart, we can see that price is kept in between 0.806 – 0.812 since 24th May. However, it is worth noting that yesterday was a US bank holiday, and as such trading activity is thin, similar to 24th May which is a Friday. Nonetheless, price is appearing to top without testing 0.812 with stochastic readings looking likely to form a bearish signal soon, hence opening up 0.806 as a viable bearish target in the short-term.
From a fundamental point of view, a large part of recent decline is attributed to the resurgence of USD strength. With US stocks taking a break from climbing higher highs, it stands to reason that USD will follow suit, and allow NZD/USD some breathing space. Whether that can translate into a strong rally ala June 2012 remains up in the air, and traders should continue to look out for both reversal and bearish continuation signs as that may indicate where price may move towards for the rest of 2013.
More Links:
USD/JPY Technicals – Bull Trend remains intact
Gold Technicals – Short term breakout potential
USD/SGD Technicals – Bullish breakout intact despite bearish correction
This article is for general information purposes only. It is not investment advice or a solution to buy or sell securities. Opinions are the authors; not necessarily that of OANDA Corporation or any of its affiliates, subsidiaries, officers or directors. Leveraged trading is high risk and not suitable for all. You could lose all of your deposited funds.

Mingze Wu
Latest posts by Mingze Wu (see all)
- European Bourses Not Enjoying Bullish Winds From US Stocks - 17 April 2014
- More Aggressive Stimulus Possible Despite Premier Li’s Denial - 17 April 2014
- China March FDI -1.5% Y/Y vs +2.05% expected. First decline in more than a year. - 16 April 2014