WTI Crude is finally showing some sign of weakness after staying lifted last week, but bulls are not letting go without a fight. Prices fell below 103.0 resistance turned support resolutely on Friday, hitting a low of 102.11 during New York midday but the bullish response was strong, driving prices back above 102.8 by the time market closed for the week. This bullish momentum carried on this morning following as Asian markets opened higher following the weekend G20 meeting that ended on an upbeat note.
However, all the bullish efforts could muster was a temporary push above 103.0, with prices moving back lower quickly. It is fair to point out that Asian equities became bearish a few hours after opening, and that could have impeded bulls ability to climb back above 103.0. Unfortunately, luck is an important factor in the world of trading as well, and all the explanation in the world cannot change the fact that prices are pointing lower now.
Hourly Chart
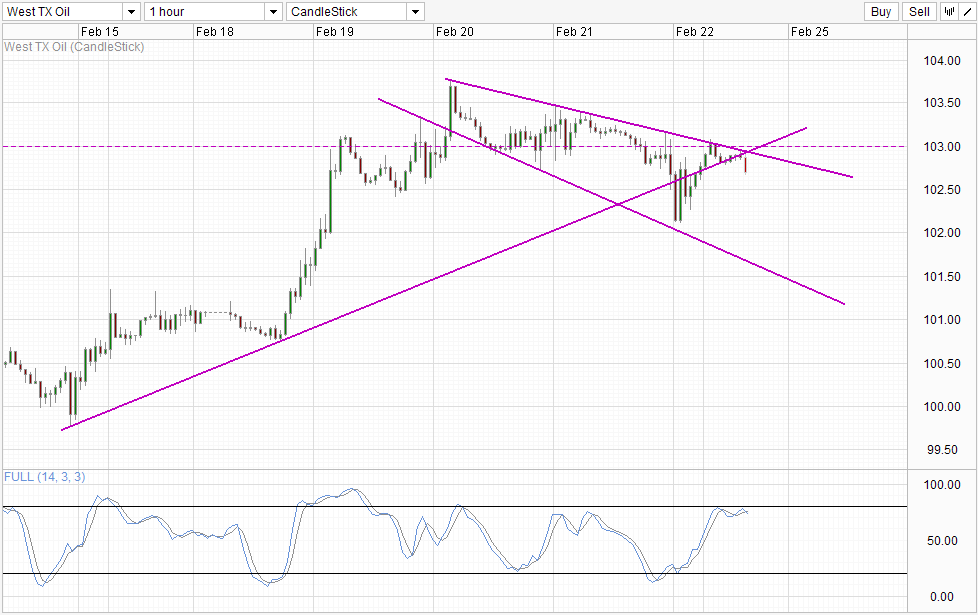
From a technical perspective, we’re looking at potential bearish acceleration lower as price has just moved away from the rising trendline and confluence with the upper wedge. This coincide with Stochastic curve crossing Signal line – indicating that a Stoch peak may have been formed. However, further confirmation may be needed – e.g. Stoch curve pushing below the 70.0 “support”, while price should preferably trade below 102.5 round figure and ideally below last Friday’s swing low in order to open up a move towards the previous resistance turned support around 101.37.
Daily Chart
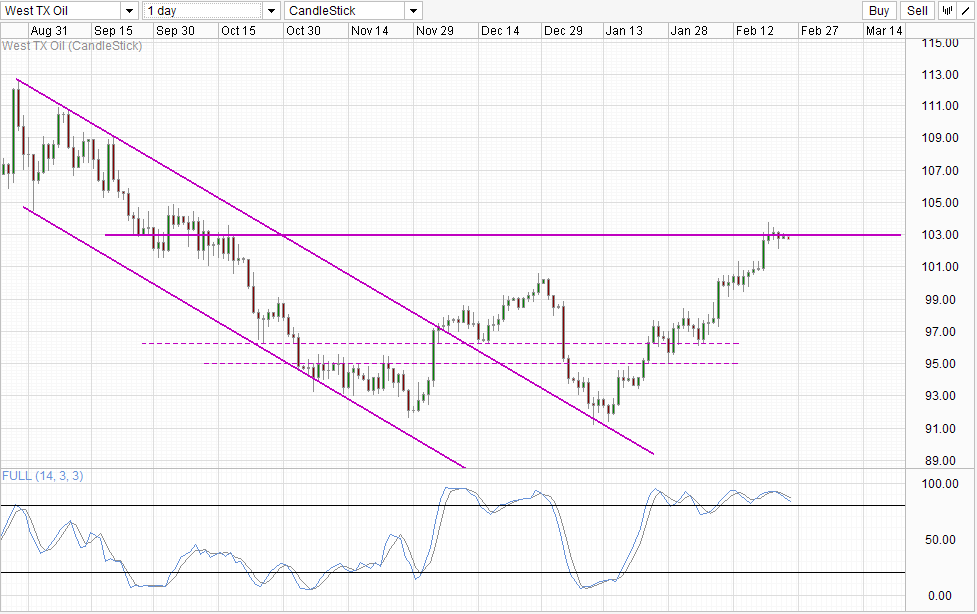
Price is looking “toppish” on the Daily Chart but it should be noted that bullish momentum hasn’t been invalidated yet. The requirements for the invalidation of bullish momentum is even higher here – where price will need to break the consolidation zone seen during mid Feb. Stochastic readings are also moving lower but we have yet to break the 80.0 mark and as such no bearish signal has been given. Nonetheless, Stoch curve should also preferably break below the 70.0 “support” level in order to affirm stronger bearish conviction.
Fundamentally, it is strange to see Crude Prices starting to weaken when global economic outlook is just starting to strengthen after G20 nations plan to increase production by $2 Trillion in 5 years. However, when we consider that Crude was rising steadily throughout Jan and most of Feb when economic data hasn’t been the most promising, it seems reasonable to assume that market has already priced in a bullish global economic scenario and what we’re seeing now is merely “buy the rumor sell the news” behavior. If this assertion is true, then upside for WTI Crude will be limited moving forward as there will be no more reason left for continued bullish endeavours, increasing downside risk moving forward.
More Links:
Gold Technicals – Losing Bullish Momentum But Staying Afloat For Now
AUD/USD Technicals – Lower In The Morning But No Panic For Bulls
EUR/USD Technicals – Early Bearish Move Seen But 1.3725 Expected To Hold
This article is for general information purposes only. It is not investment advice or a solution to buy or sell securities. Opinions are the authors; not necessarily that of OANDA Corporation or any of its affiliates, subsidiaries, officers or directors. Leveraged trading is high risk and not suitable for all. You could lose all of your deposited funds.

Mingze Wu
centers on forex and macro-economic trends impacting the Asia Pacific region.

Latest posts by Mingze Wu (see all)
- European Bourses Not Enjoying Bullish Winds From US Stocks - 17 April 2014
- More Aggressive Stimulus Possible Despite Premier Li’s Denial - 17 April 2014
- China March FDI -1.5% Y/Y vs +2.05% expected. First decline in more than a year. - 16 April 2014