US stocks enjoyed a reprieved with S&P 500 gaining 0.76% and Dow Jones +0.72%. This is a welcome bullish change of tune, but does it mean that overall sentiment has shifted? Well, Nasdaq 100 which tend to be the most risk sensitive gained the most at 0.86%, while there were some slight positive US economic news in the form of ISM New York, Factory Orders and IBD/TIPP Economic Optimism. Hence, there are some fundamental support to a potential shift in sentiment.
Hourly Chart
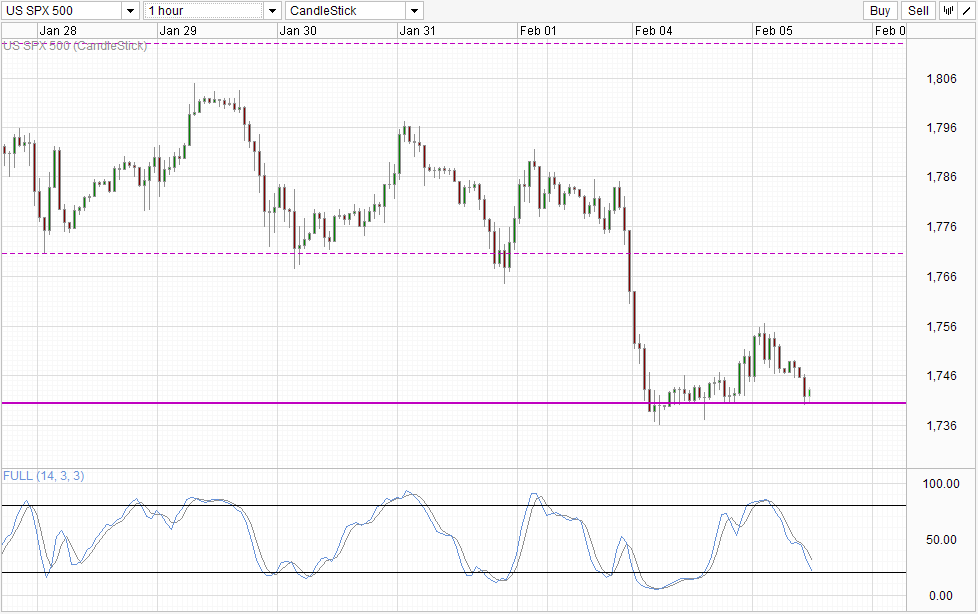
However, from a price action point of view, the broad bearish sentiment is far from over. The highest that S&P 500 managed to climb was 1,756, a far cry from the 1,770 support turned resistance. This also represented less than 50% of the decline that was suffered on Monday – a key reversal requirement if you ask Fib traders. In any case, whether you agree with the 50% benchmark, the fact of the matter is that prices have since collapsed rather dramatically, with prices currently finding support around 1,740. This is a strong sign that yesterday’s bullish push was simply a technical pullback/dead cat bounce, and that overall bearish sentiment is still in play.
That being said, traders should still wait for confirmation of the bearish sentiment which can be affirmed with a break of the aforementioned 1,740. Current setup simply suggest that bullish momentum is not really in play, but there is still possibility of price rebounding off 1,740 back up to 1,745 or even back towards 1,756. However, without breaking back above 1,770, it will be hard to get the bullish narrative going and bears will still be favourites going forward.
Daily Chart
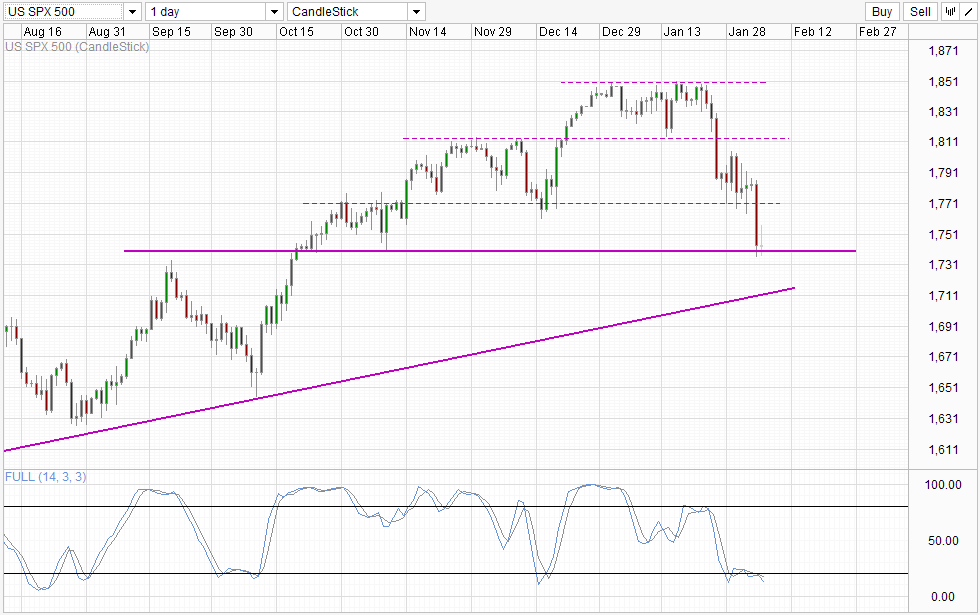
Daily Chart highlights the importance of not committing into the bearish run pre-emptively. The Doji candle suggest that there is indeed uncertainty, which opens up the possibility of a potential rebound higher if a Morning Star bullish reversal pattern is formed. It is still possible that the Doji candle may simply be a point of inflexion and made this into a continuation pattern, but in that scenario it will be difficult to imagine prices heading much further lower with the rising trendline close by. Hence, the most bearish scenario moving forward would actually include a sideways trend which allows bears to rest and Stochastic readings and the rising trendline to move higher. When the eventual 1,740 break does happen, it is likely that the rising trendline will be broken as well, resulting in a much stronger bearish breakout compared to if it happens now.
Certainly all these are paper talk, and it is entirely possible that things do not work out that way, but all these do add reasons for additional caution for now as current setup is not the most bullish nor bearish that one can have, and though you may miss out potential opportunities, there is wisdom in not trading when direction aren’t clear.
More Links:
EUR/USD – Consolidates around 1.35
AUD/USD – Breaks Through 0.88 to Three Week High above 0.89
GBP/USD – Bounces Off Support at 1.6250
This article is for general information purposes only. It is not investment advice or a solution to buy or sell securities. Opinions are the authors; not necessarily that of OANDA Corporation or any of its affiliates, subsidiaries, officers or directors. Leveraged trading is high risk and not suitable for all. You could lose all of your deposited funds.

Mingze Wu
centers on forex and macro-economic trends impacting the Asia Pacific region.

Latest posts by Mingze Wu (see all)
- European Bourses Not Enjoying Bullish Winds From US Stocks - 17 April 2014
- More Aggressive Stimulus Possible Despite Premier Li’s Denial - 17 April 2014
- China March FDI -1.5% Y/Y vs +2.05% expected. First decline in more than a year. - 16 April 2014