WTI prices shot up yesterday out of the blues. Certainly risk appetite helped send the commodity prices higher, but the strong gains seen in Crude wasn’t matched by any other major risk correlated asset yesterday barring Nikkei 225. But strangely it should be noted that WTI prices actually traded lower yesterday during Asian hours when risk appetite was the strongest, and funnily prices gained much more during late US session when US stocks are not exactly bullish.
If today’s news headlines are anything to go by, the main reason for the extra ordinary rally is attributed to additional hedge funds speculative bets. Or, if other newswires are to be believed, it is the cold weather that is driving energy demand. Related to this point, some say that it is due to the unexpectedly high inventory drawdown to the tune of 1.0-1.5 million barrels. All these points raised are not exclusive of each other, and it is entirely possible that a narrative can be woven: hedge funds buying WTI contracts in huge volume speculating that there will be an unexpected drawdown of inventory (to be released by Department of Energy on Friday) due to the cold weather. However, the fact that so many different news outlets are not speaking in the exact same tune suggest that they are only getting piecemeal information – in summary, nobody has a proper clue of what caused it exactly, and we are all speculating here.
Hourly Chart
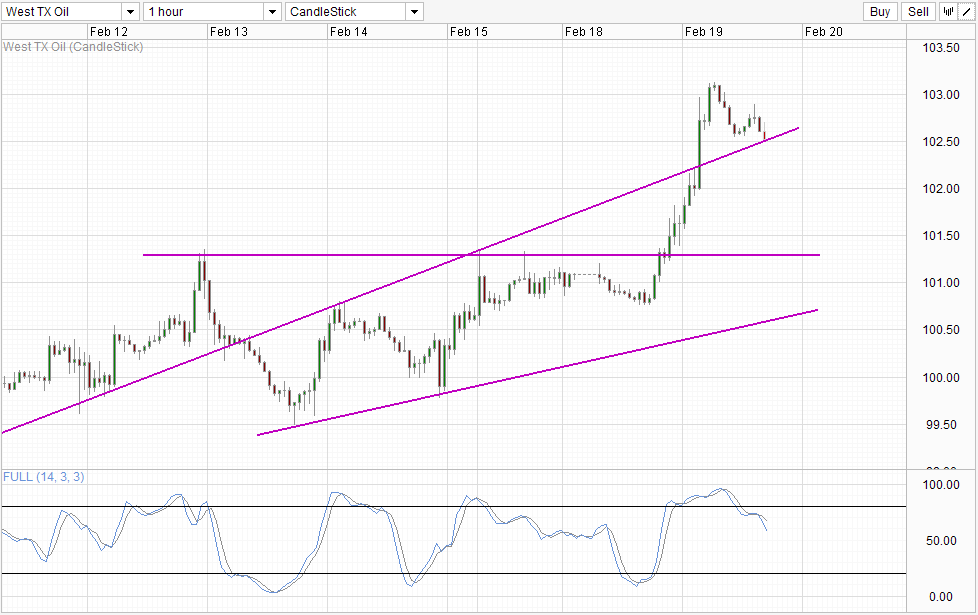
Hence, it is no surprise that prices are currently pulling lower, and we are testing 102.5 round figure which happens to be the confluence with rising trendline. Stochastic readings also agree, with a fresh bearish cycle emerging with more than half of the cycle to go. As such, if 102.5 is broken, it is possible that we could see further selling to bring us back to 101.37 where all it started. However, as we do not truly know the reasons for yesterday’s rally, it may be premature to assume that the reasons for the rally has dissipated. Hence, bears need to be prepared that we may never reach 101.37 even in the event of a trendline break, and traders who are holding short position with small profits may wish to evaluate if continuing holding shorts is worth the risk when bearish momentum start to stall around the 102.0 region.
Daily Chart
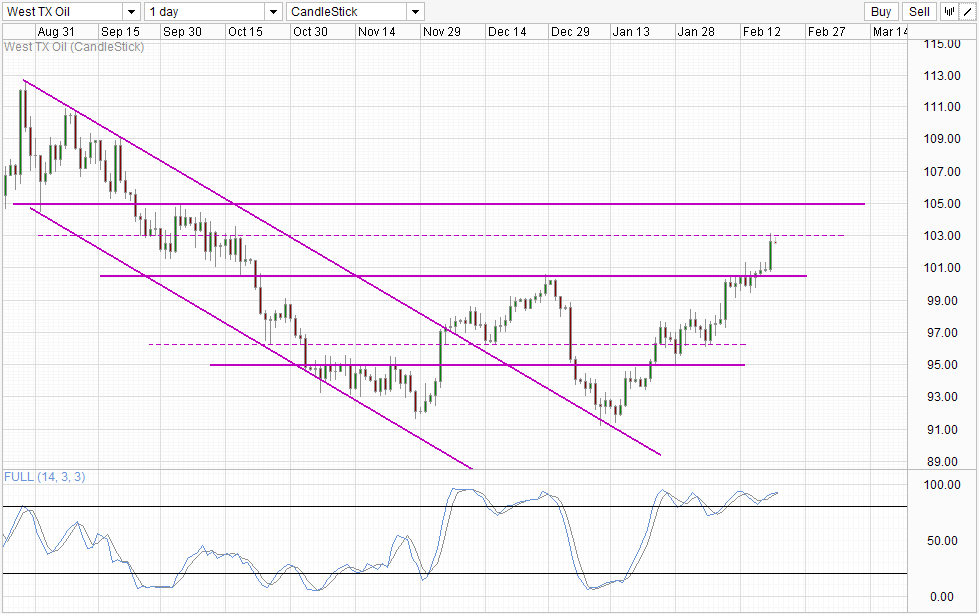
Daily Chart shows the strong bullish momentum that has been in play since mid Jan, and there is no sign that this momentum is abating. This lends further strength to the S/T conservative approach as a S/T bearish move can be regarded as counter-trend.
Looking at Daily Chart alone, current bullish momentum seems to be on track to reach 105.0 resistance. 103.0 round figure is not really a “strong” resistance level on the daily chart as it is merely the midpoint of the consolidation seen in Oct ’13. Hence, to not be surprised if WTI is able to break this level on pure momentum alone without fundamental support. Of more concern is the fact that bullish rally haven’t suffered any significant bearish pullback, with Stoch readings staying within the Overbought region for a large portion during the rally. This demonstrates the unreliability of counter-trend Stoch signals during strong trends, as such we can reasonably ignore the fact that Stochastic readings appear toppish right now. But this doesn’t change the fact that the risk of a significant pullback is high moving forward, and traders will need to take that into consideration if they wish to long WTI.
More Links:
EUR/USD Technicals – Bullish Sentiment Stable Despite Slight Bearish Pullback
AUD/USD Technicals – Above 0.90 But Bearish Momentum Threatens Further Losses Ahead
This article is for general information purposes only. It is not investment advice or a solution to buy or sell securities. Opinions are the authors; not necessarily that of OANDA Corporation or any of its affiliates, subsidiaries, officers or directors. Leveraged trading is high risk and not suitable for all. You could lose all of your deposited funds.

Mingze Wu
Latest posts by Mingze Wu (see all)
- European Bourses Not Enjoying Bullish Winds From US Stocks - 17 April 2014
- More Aggressive Stimulus Possible Despite Premier Li’s Denial - 17 April 2014
- China March FDI -1.5% Y/Y vs +2.05% expected. First decline in more than a year. - 16 April 2014