The perceived impact of China’s Wuhan virus on global growth is taking its toll on oil prices. Precious metals embrace the safe-haven environment while the agricultural sector remains mixed.
Energy
The spread of the coronavirus is pressuring CRUDE OIL prices amid expectations that the impact could affect global growth projections as Chinese companies remain closed for an extended period. West Texas Intermediate (WTI) hit levels not seen in more than a year in early trading this morning, and the decline has sparked speculation that OPEC may convene an extraordinary meeting to address the trend, with rumours circulating of a February 4-5 gathering.
As a result of the virus, Bloomberg estimated that China’s oil demand has dropped by three million barrels, or about 20%, the biggest shock to demand since the Global Financial Crisis in 2008/09. The number of US oil rigs in production tailed off last week, the first decline in three weeks.
Speculative investors reduced net long positions for a third consecutive week to January 28, according to the latest data snapshot from CFTC. Net longs are now at the lowest since the week of December 3.
WTI fell for a fourth consecutive day yesterday as the number of confirmed coronavirus climbed above 20,000 globally and the number of deaths has risen to 426, an attrition rate of about 2%. The 100- and 200-day moving averages have converged just above the $57.00 mark.
WTI Daily Chart

Source: OANDA fxTrade
NATURAL GAS prices remain under pressure despite forecasts of colder-than-normal temperatures in the US for the February 10-15 period. Prices are languishing near four-year lows with the 55-, 100- and 200-day moving averages all tending lower.
Speculators remain bearish on the commodity, with net short positioning matching the highs seen in June 2015. Data from the Energy Information Administration released last week showed a reduction of 201 billion cubic feet (bcf) in stockpiles, the biggest drop since March last year.
Precious metals
GOLD remains supported by the desire to hold safe haven assets during this virus period, but has so far lacked the momentum to maintain any break above the psychological 1,600 level. The metal advanced during December and January but is so far trading negatively this month.
Speculative accounts remain solidly bullish on gold however, increasing net long positions to the most since records began in 1993. Exchange-traded funds (ETFs) increased their gold holdings for an eighth consecutive session as at yesterday, according to Bloomberg reports, bringing net purchases for the year to 730,000 ounces.
SILVER likewise has struggled to keep its upward trajectory during 2020 after reaching a near-term peak on January 8. It’s still maintaining a foothold above the 55-day moving average at 17.477 and that moving average has supported prices on a closing basis since December 20.
The lack of upward momentum has tested the patience of silver bulls and speculative investors have reduced net long positions to the least in four weeks, according to CFTC data.
PALLADIUM is consolidating last week’s drop which saw prices fall to the lowest in a week and more than 10% off the January 21 peak. The recent decline has seen some speculative investors rush to book profits and net long positioning has been scaled back over the last three weeks to the lowest levels since the week of September 11, the latest CFTC reports shows.
PLATINUM touched a 3-1/2 week low yesterday as global slowdown fears prompted concerns that industrial demand for the metal could wane. The 55-day moving average at 948.52 remains intact as support and prices have held above it since December 10. Speculative investors remain bullish however, with net long positioning as of January 28 at the highest levels since records began in 1993, according to the latest data from CFTC.
Base metals
COPPER has been on the longest losing streak since November 2015 as the extended shutdown after the Lunar New Year break in China’s industrial heartlands has taken its toll on demand. In the 10 days from January 20, the metal has fallen 12.5% and reached levels now seen since September 3. As at January 28, speculative accounts turned net bearish on the metal for the first time in three weeks, according to CFTC data.
Copper Daily Chart

Source: OANDA fxTrade
Agriculturals
CORN has been trapped in a 3.60-3.88 range since October 21 and is currently sitting on the 55-day moving average at 3.7419. Despite the lack of direction, there has been steady demand for US produce, and it’s not from China. The US Department of Agriculture reported that US corn exports were up 23% on the week to January 23, with demand coming from Mexico, Japan, Colombia and Guatemala.
The projected SUGAR shortage for this season is keeping prices buoyant, hitting the highest level since January 2018 yesterday. Prices are nearing the 38.2% Fibonacci retracement level of the September 2016 to August 2018 decline at 0.1508. That’s also close to the 200-month moving average at 0.1516.
Adding to the global shortage, India forecast that its 2019/20 sugar output would fall 17% to 27.4 million tons. Speculative accounts remain bullish on the commodity, lifting net long positions to the highest since March 2017, CFTC data show.
Sugar Monthly Chart
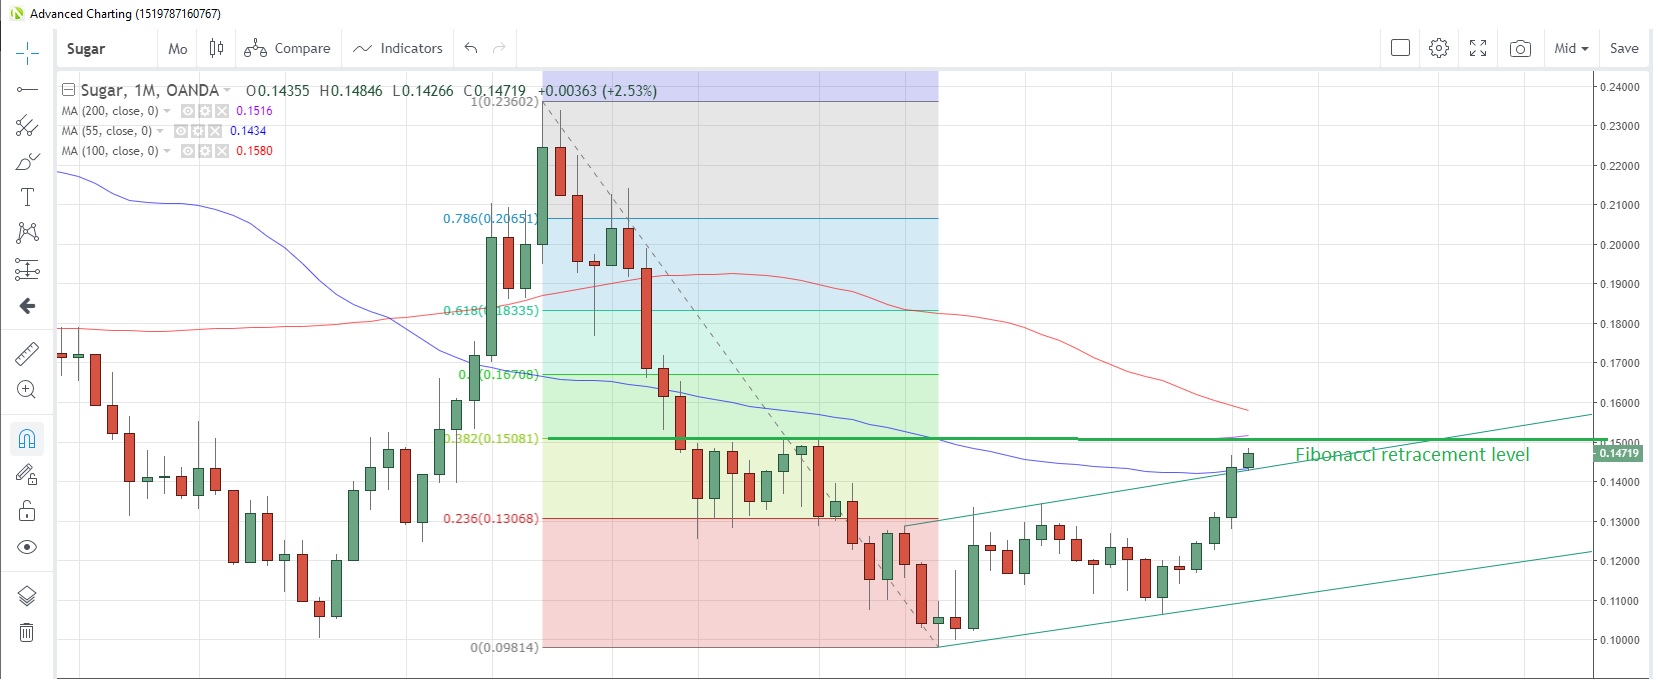
Source: OANDA fxTrade
SOYBEANS look poised to extend the current rebound from two-month lows to a second day today. Prices had touched the lowest since December 3 yesterday but rebounded strongly into the close. Speculative investors were net sellers of the commodity for a second week in the week to January 28, according to CFTC data. Net positioning turned bearish for the first time in six weeks, the data showed.
WHEAT hit the lowest level in 3-1/2 weeks yesterday amid concerns that China purchases may slow as a result of the coronavirus outbreak. The commodity is still holding above the 55-day moving average at 5.4538, as it has done since September 26. Speculative investors turned net sellers for the first time in five weeks in the week to January 28, according to the latest CFTC data.
Content is for general information purposes only. It is not investment advice or a solution to buy or sell securities. Opinions are the authors; not necessarily that of OANDA Business Information & Services, Inc. or any of its affiliates, subsidiaries, officers or directors. If you would like to reproduce or redistribute any of the content found on MarketPulse, an award winning forex, commodities and global indices analysis and news site service produced by OANDA Business Information & Services, Inc., please access the RSS feed or contact us at info@marketpulse.com. Visit https://www.marketpulse.com/ to find out more about the beat of the global markets. © 2023 OANDA Business Information & Services Inc.

Andrew Robinson
Latest posts by Andrew Robinson (see all)
- RBA cuts rates on virus impact - 2 March 2020
- Commodities Weekly: Oil rises first time in eight days - 2 March 2020
- Daily Markets Broadcast 2020-03-03 - 2 March 2020