How low will oil go?
It’s been a pretty woeful week for oil prices, now off more than 5% from last Friday’s peak and showing little sign of letting up.
Trump may be able to claim responsibility for this correction – with his bizarre claims last week that he’d spoken with OPEC undoubtedly being the initial catalyst – but the reality is that this was already a very overbought market that just needed a nudge in the right direction and the inventory data we’ve seen this week just compounded that. Perhaps that was Trump’s real intention all along.
Brent Daily Chart
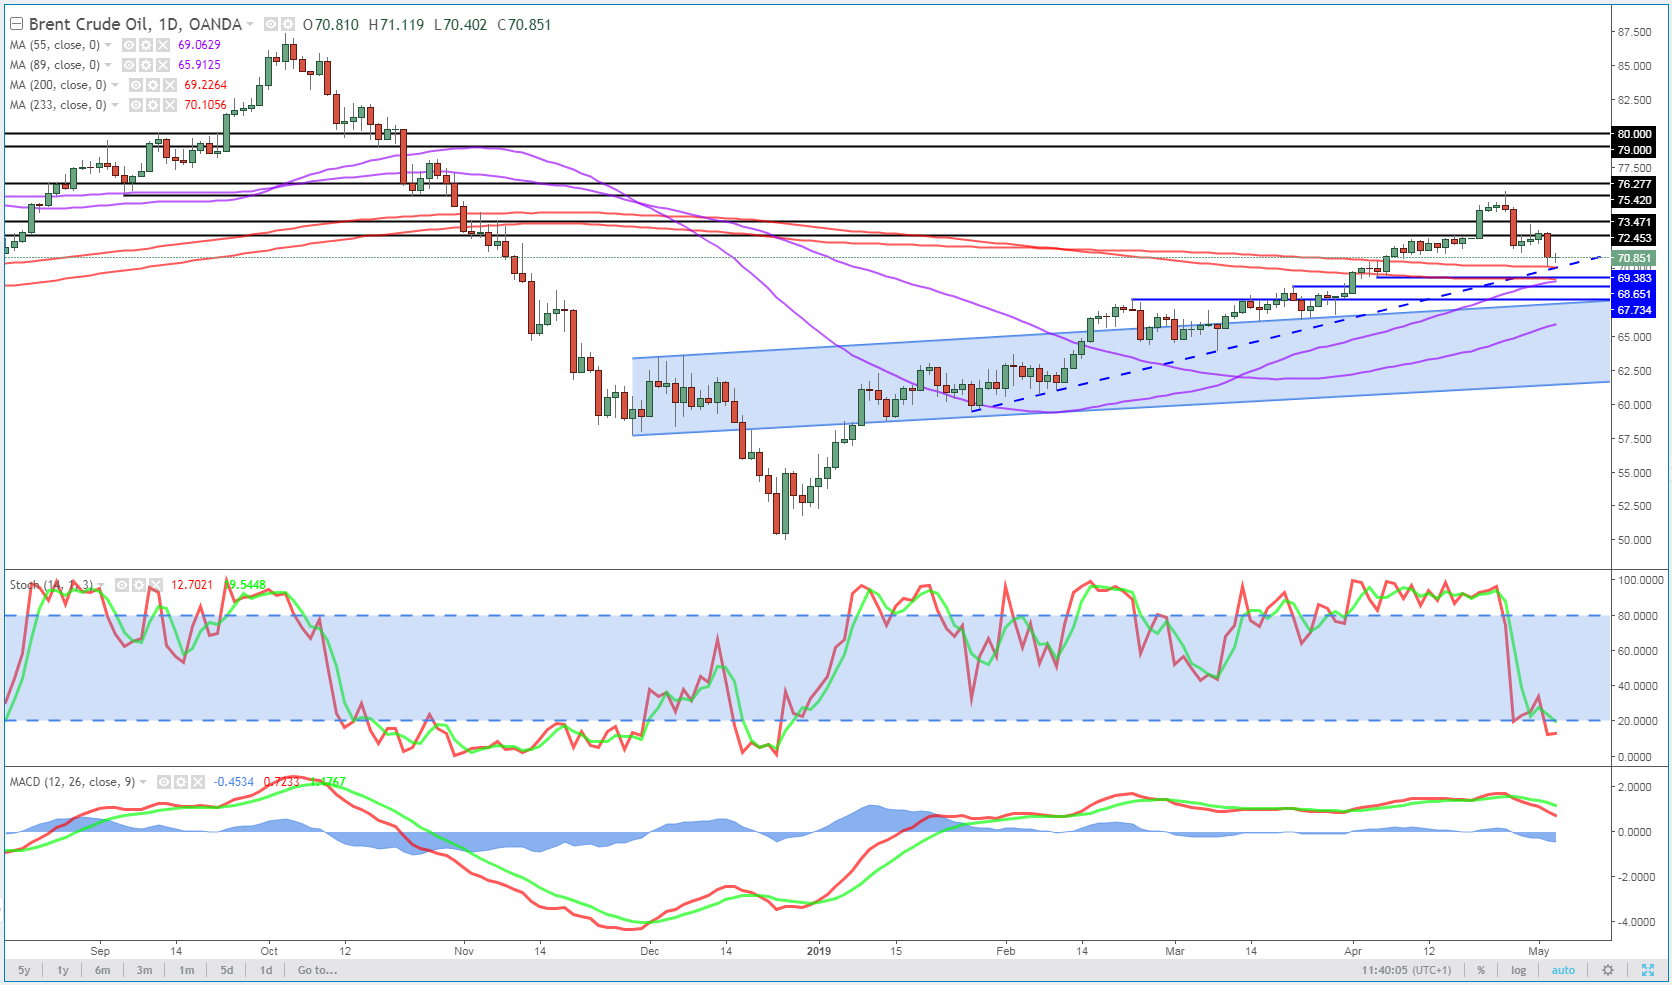
OANDA fxTrade Advanced Charting Platform
Now it’s simply a question of how big a correction we’re facing and whether recent moves will knock the confidence of oil bulls or has presented an opportunity to add at cheaper prices. The fundamentals are clearly a mixed bag.
On the one hand we have record US output and slower growth. On the other, Iranian waivers have now expired and OPEC+ compliance with the output cut has been strong. One unknown is whether that continues beyond June. Perhaps current levels are pretty adequate under the circumstances.
What about the technical picture?
As you can see on the daily chart above, we’ve clearly now stumbled upon a very interesting area in Brent. The 55, 200 and 233 all combine here to make this a notable support zone. The fact that this also coincides with prior support and resistance and a rising trend line just makes it more interesting again.
Brent 4-Hour Chart
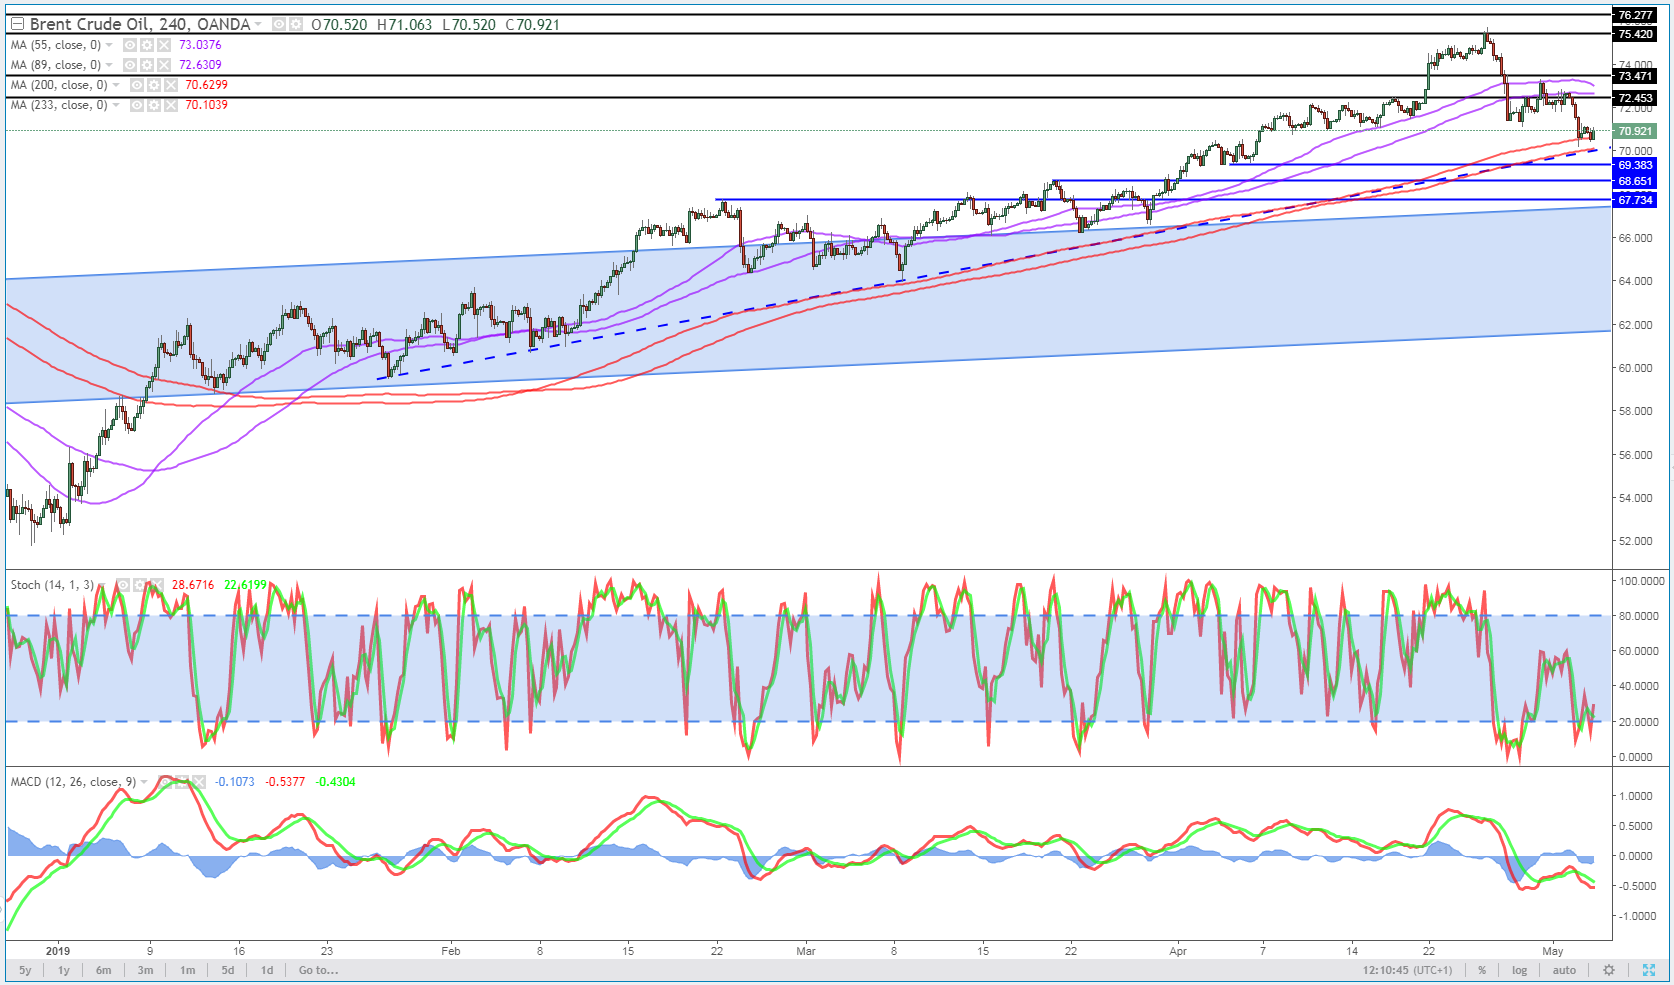
A look at the 4-hour chart suggests it doesn’t end there. Since breaking above the 200 and 233 simple moving average at the start of the year, price has stayed above here and rotated higher on each approach. We haven’t really seen a major test of it until now. Should we break below here and the trend line, which has been tested repeatedly, it could well be a bearish signal and provide an earlier indicator than the daily chart.


Content is for general information purposes only. It is not investment advice or a solution to buy or sell securities. Opinions are the authors; not necessarily that of OANDA Business Information & Services, Inc. or any of its affiliates, subsidiaries, officers or directors. If you would like to reproduce or redistribute any of the content found on MarketPulse, an award winning forex, commodities and global indices analysis and news site service produced by OANDA Business Information & Services, Inc., please access the RSS feed or contact us at info@marketpulse.com. Visit https://www.marketpulse.com/ to find out more about the beat of the global markets. © 2023 OANDA Business Information & Services Inc.

Former Craig
Latest posts by Former Craig (see all)
- Market Insights Podcast – US GDP, RBNZ holds, bitcoin soars - 28 February 2024
- Market Insights Podcast – Nvidia earnings, record highs for stocks - 23 February 2024
- EUR/USD – A bullish breakout or just further consolidation? - 22 February 2024