WTI looking overstretched
Oil prices are spending a third day in the red, coming off the highs that were reached earlier in the week after the US announced it would not extend waivers on oil imports from Iran, which had previously been afforded to eight countries.
This was an unexpected development and triggered another rally in oil prices as traders weighed up the impact of up to a million barrels of oil disappearing, clearly not buying the line that the US, Saudi Arabia and UAE would fill the gap.
Inventory data will have contributed to declines of the last few days, with API and EIA both reporting large increases in stocks.
WTI Crude Daily Chart
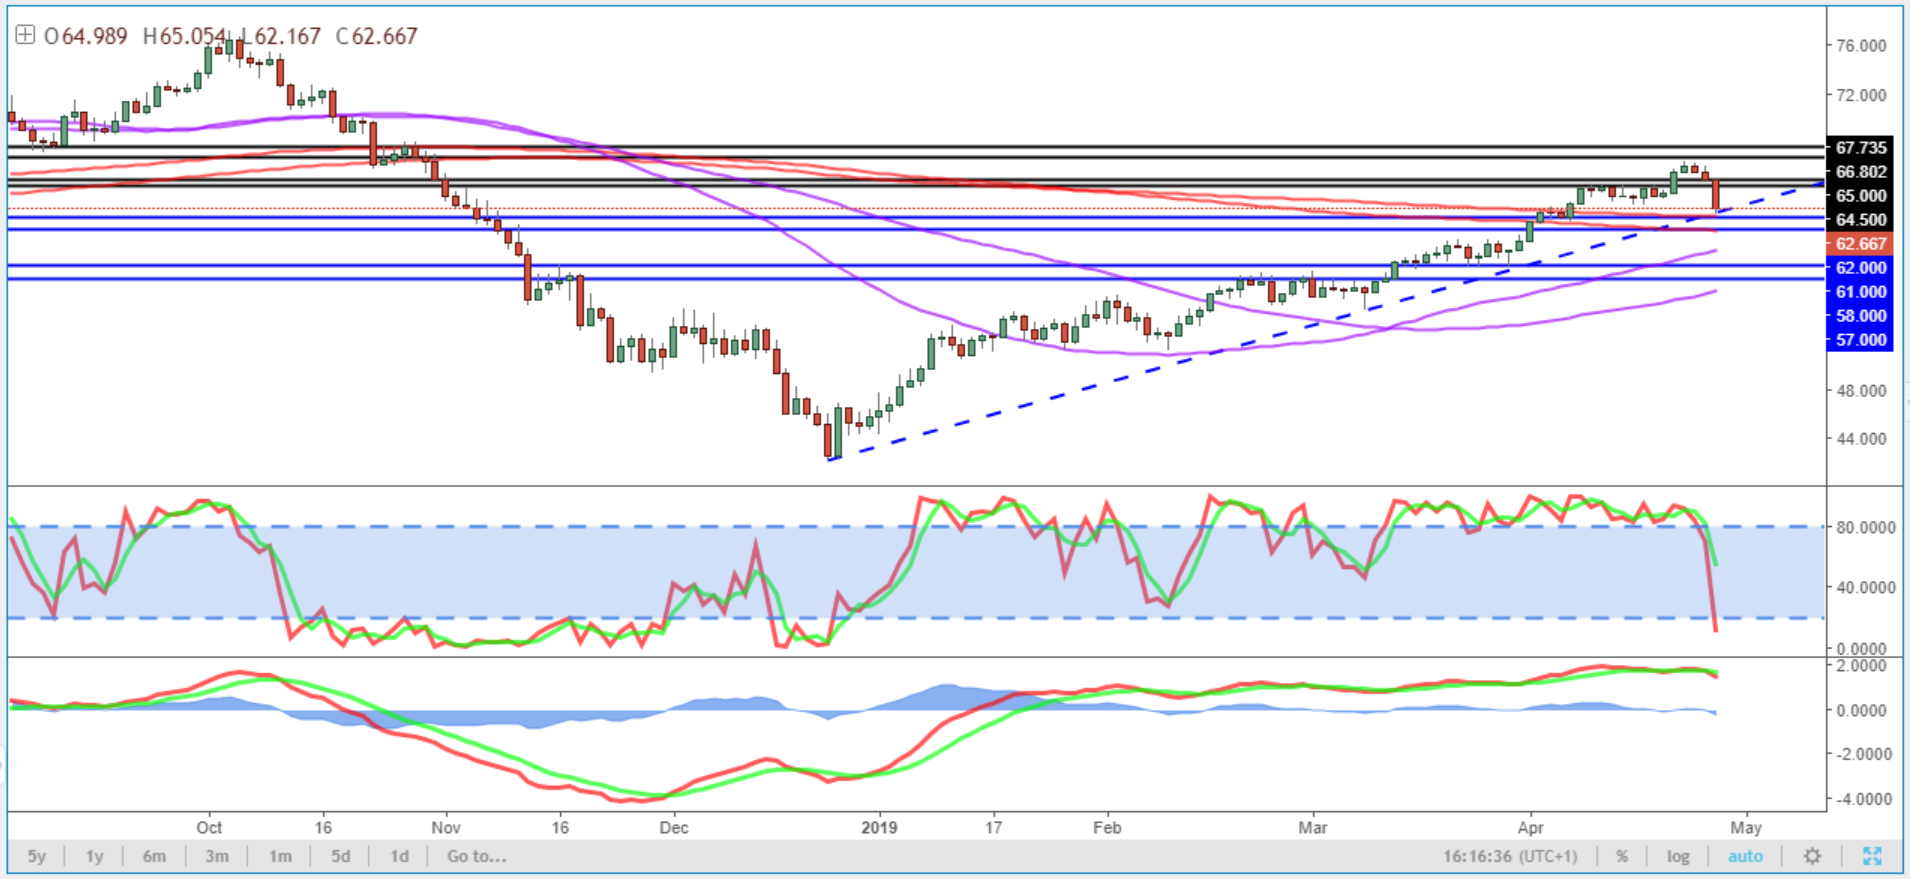
OANDA fxTrade Advanced Charting Platform
Still, WTI remains in a good position, although they are looking a little overstretched to the upside at this point. The last couple of peaks have come amid slowing momentum which is typically a red flag and may indicate a correction in prices.
WTI is trading more than 3% lower at the time of writing and while this is being partially attributed to Trump’s claim that he called OPEC and told it to bring oil prices down, the move was already underway and when an instrument is overbought, it doesn’t tend to take much to trigger an oversized move. This is a prime example of that.
WTI now faces a big test around $61-62 range, with prior support and resistance combining with the 200 and 233-day simple moving averages to offer potential support. A break below here would be a very bearish development, with $57-58 being the next test.


Content is for general information purposes only. It is not investment advice or a solution to buy or sell securities. Opinions are the authors; not necessarily that of OANDA Business Information & Services, Inc. or any of its affiliates, subsidiaries, officers or directors. If you would like to reproduce or redistribute any of the content found on MarketPulse, an award winning forex, commodities and global indices analysis and news site service produced by OANDA Business Information & Services, Inc., please access the RSS feed or contact us at info@marketpulse.com. Visit https://www.marketpulse.com/ to find out more about the beat of the global markets. © 2023 OANDA Business Information & Services Inc.

Former Craig
Latest posts by Former Craig (see all)
- Market Insights Podcast – US GDP, RBNZ holds, bitcoin soars - 28 February 2024
- Market Insights Podcast – Nvidia earnings, record highs for stocks - 23 February 2024
- EUR/USD – A bullish breakout or just further consolidation? - 22 February 2024