The sharp rebound in China’s PMI data in March helped the energy and industrial commodities but worked against the precious metals. Agricultural commodities were mixed.
Precious metals
PALLADIUM suffered its worst week since at least 2005, which is when Oanda began collecting data, and posted the biggest monthly loss in March since 2011. There was no specific news to knock it off its pedestal, but more the view from an increasing number of analysts that its relative expense to platinum could make its cheaper cousin more appealing for use in catalytic converters.
Speculative investors have been trimming their net long positions for the past five weeks as the metal rallied, and they are now at the lowest since the week of October 30, according to the latest data snapshot from CFTC as at March 26.
The metal has tested support at the 100-day moving average of 1,354.53, which held on a closing basis so far, as it has done since August 28 last year.
Palladium Daily Chart
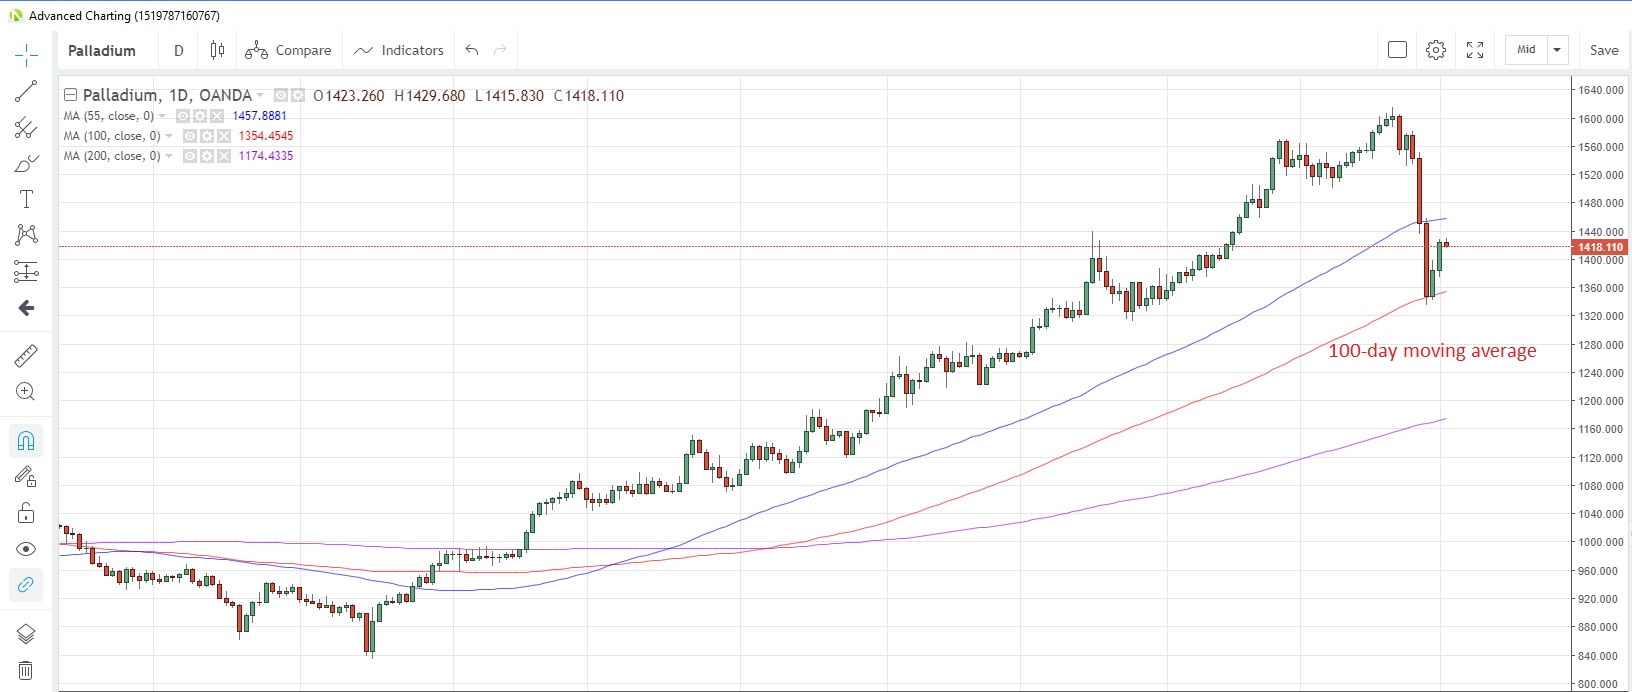
Source: OANDA fxTrade
PLATINUM looks on track to post its fourth consecutive weekly gain this week as known ETF holdings of the metal increased for a third straight month last month, and are now at the highest on record, according to Bloomberg. Speculative investors also turned more bullish as they increased their net long positions in the week to March 26, boosting them to the highest in a year.
GOLD has fallen victim to the pickup in risk appetite over the last week caused by the rebound in the China manufacturing sector, as evidenced by the PMI readings. Reduced desire to hold safe haven assets drove the yellow metal down to the lowest in 3-1/2 weeks yesterday, having once again given up the 1,300 handle.
Investment bank Goldman Sachs remains bullish on gold amid demand from ETFs and central banks. It maintained its 12-month forecast of 1,450 in a recent client note. Meanwhile, the Uzbekistan central bank has said the country will export more gold this year. It forecasts exports of 80 tons this year, matching the total from 2017 after a dip to 70 tons last year.
SILVER is attempting a rebound from 2019 lows this week after suffering from a period of reduced demand. The metal touched 14.98 last week, the lowest since December 27. It’s now at 15.10 with the 100-day moving average acting as immediate resistance at 15.207. Speculative investors turned net buyers of the metal for the first time in four weeks in the week to march 26, the latest data from CFTC shows.
Base metals
The less-gloomy outlook for global growth has given COPPER a boost, pushing the metal to the highest in nine months yesterday after posting the biggest quarterly gain since end-2017 in Q1. Speculative accounts were not prepared for the rebound, as net long positions were at the lowest in five weeks, according to the data snapshot from CFTC as at March 26.
The supply side is seeing both good and bad news, with labour strikes being avoided at a mine in Chile but those at a Peru mine continuing. The Peru central bank sees the country raising its trade surpluses in 2019 and 2020 as a result of higher copper prices and a pickup in demand, according to a report at the weekend. Meanwhile a China trade association sees the nation using 7%-8% more copper in wires and cables this year.
Energy
CRUDE OIL posted the biggest quarterly gain in a decade in Q1 as OPEC’s determination to trim production to support prices took hold. Despite speculation that an increase in US production would help reduce the supply deficit, a recent report from the US Energy Information Administration (EIA) published Friday showed that average US oil production fell for the first time in six months in January to 11.87 billion barrels from 11.96 billion the prior month. During January, West Texas Intermediate rallied almost 18%, the biggest monthly jump since April 2015.
Speculative investors remain bullish on oil prices, with net non-commercial long futures positions at the highest since the week of February 12, according to the March 26 snapshot from CFTC. WTI is now at $61.62 and is testing the 200-day moving average at $61.59 for the first time since October 29.
WTI Daily Chart

Source: OANDA fxTrade
NATURAL GAS continued to weaken last week, extending recent losses to three weeks in a row. Prices have struggled to gain any traction and have remained below the 55-day moving average (at 2.8351 today) since December 24. The lack of upward momentum comes despite EIA data last week showing another week of drawdowns on stockpiles, adding up to a run of nineteen weeks.
There may be some glimmer of hope after Bloomberg calculations yesterday suggested UK demand would spike to the highest in two weeks as a cold snap hits across the country. Speculative positioning implies lower expectations for further weakness too, as net short positions were trimmed to their lowest since the week of February 12, according to the latest CFTC data.
Agriculturals
The prospect of abundant supplies has kept CORN under pressure in the past week following a report from the US Department of Agriculture suggesting US growers were to increase planted acreage to 92.8 million acres, a 4.1% jump compared to a year ago. Friday saw the biggest one-day drop in almost three years to 3.494, the lowest since October 1. Corn is now at 3.563.
Corn Daily Chart
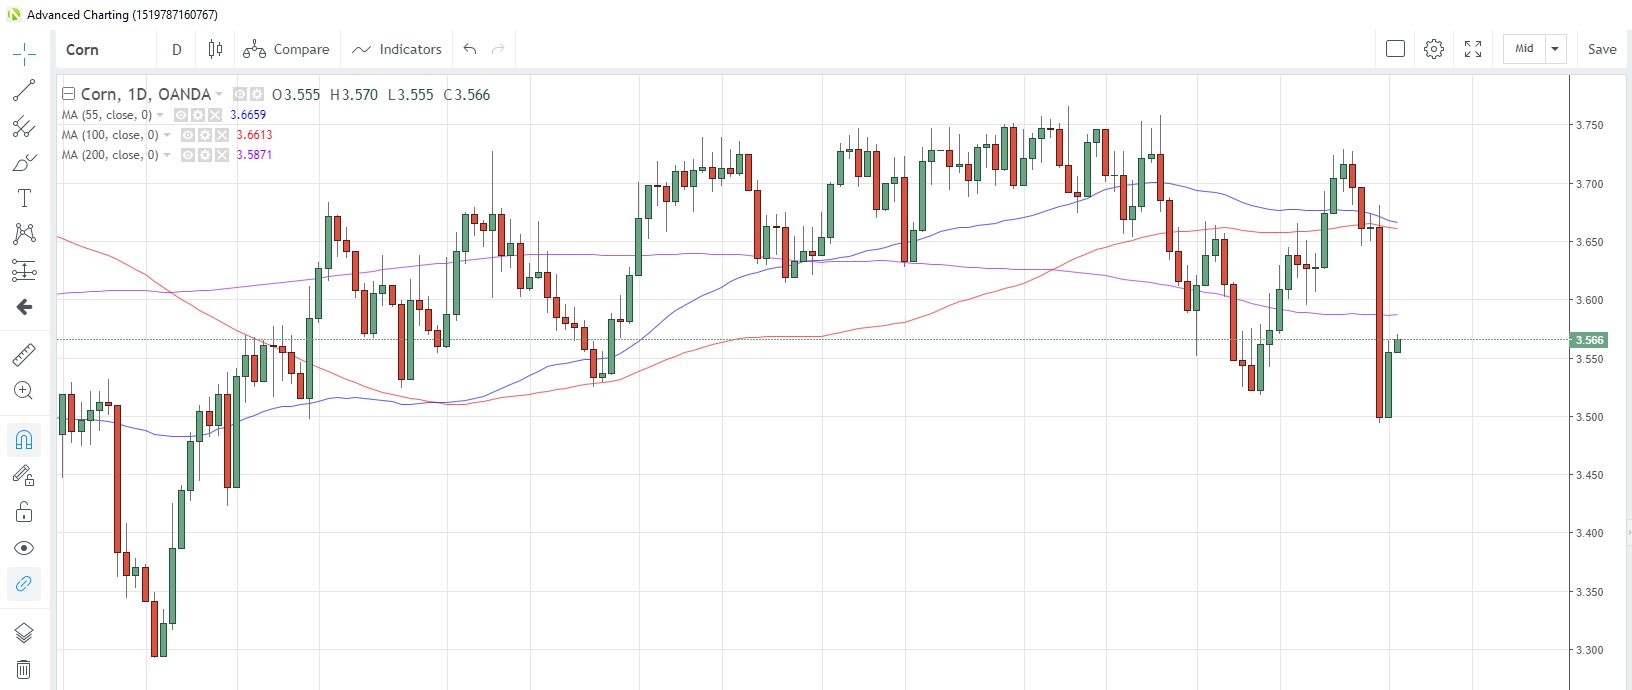
Soyurce: OANDA fxTrade
WHEAT snapped a two-week rising streak last week but is trading positively again this week after news emerged that Iraq had bought 300,000 tons of US wheat. Speculative investors reduced net short positions for a third week in the week to March 26, CFTC data shows.
SOYBEANS have extended the rebound from the 200-day moving average support at 8.7275 to a second day, amid reports that China had bought about 800,000 tons of US soybeans last Friday as the US-China trade talks dragged on. Soybeans are now at 8.910 with the 200-day moving average supporting below and the 55-day moving average at 8.9731 acting as resistance above.
SUGAR prices have risen today for the first time in three days as India said its exports were struggling to advance amid low prices and a high local currency. Prices bounced off the 100-day moving average at 0.1240 earlier and are now at 0.1270.
Content is for general information purposes only. It is not investment advice or a solution to buy or sell securities. Opinions are the authors; not necessarily that of OANDA Business Information & Services, Inc. or any of its affiliates, subsidiaries, officers or directors. If you would like to reproduce or redistribute any of the content found on MarketPulse, an award winning forex, commodities and global indices analysis and news site service produced by OANDA Business Information & Services, Inc., please access the RSS feed or contact us at info@marketpulse.com. Visit https://www.marketpulse.com/ to find out more about the beat of the global markets. © 2023 OANDA Business Information & Services Inc.

Andrew Robinson
Latest posts by Andrew Robinson (see all)
- RBA cuts rates on virus impact - 2 March 2020
- Commodities Weekly: Oil rises first time in eight days - 2 March 2020
- Daily Markets Broadcast 2020-03-03 - 2 March 2020