Friday’s weak flash PMI readings from Europe and the US raised concerns about global growth going forward, and an increasingly inverted US yield curve both weakened the US dollar and heightened concerns about a pending recession. Most commodities benefited from a weaker greenback.
Precious metals
GOLD advanced to its highest level this month yesterday as uncertainty and a falling dollar raised its appeal as a safe haven. The precious metal traded above the 61.8% Fibonacci retracement level of the February 20 to March 5 drop at 1,321.72 for the first time since February 28 yesterday, and looks on track for the fourth consecutive weekly gain this week. Gold is now at $1,321.88.
Speculative accounts added to their net long positions for the first time in four weeks in the week to March 19, the latest data from CFTC shows, after net longs had fallen to the lowest level in seven weeks. India’s gold imports slid 5.5% to $29.5 billion in the April 2018 to February 2019 period.
Gold Daily Chart
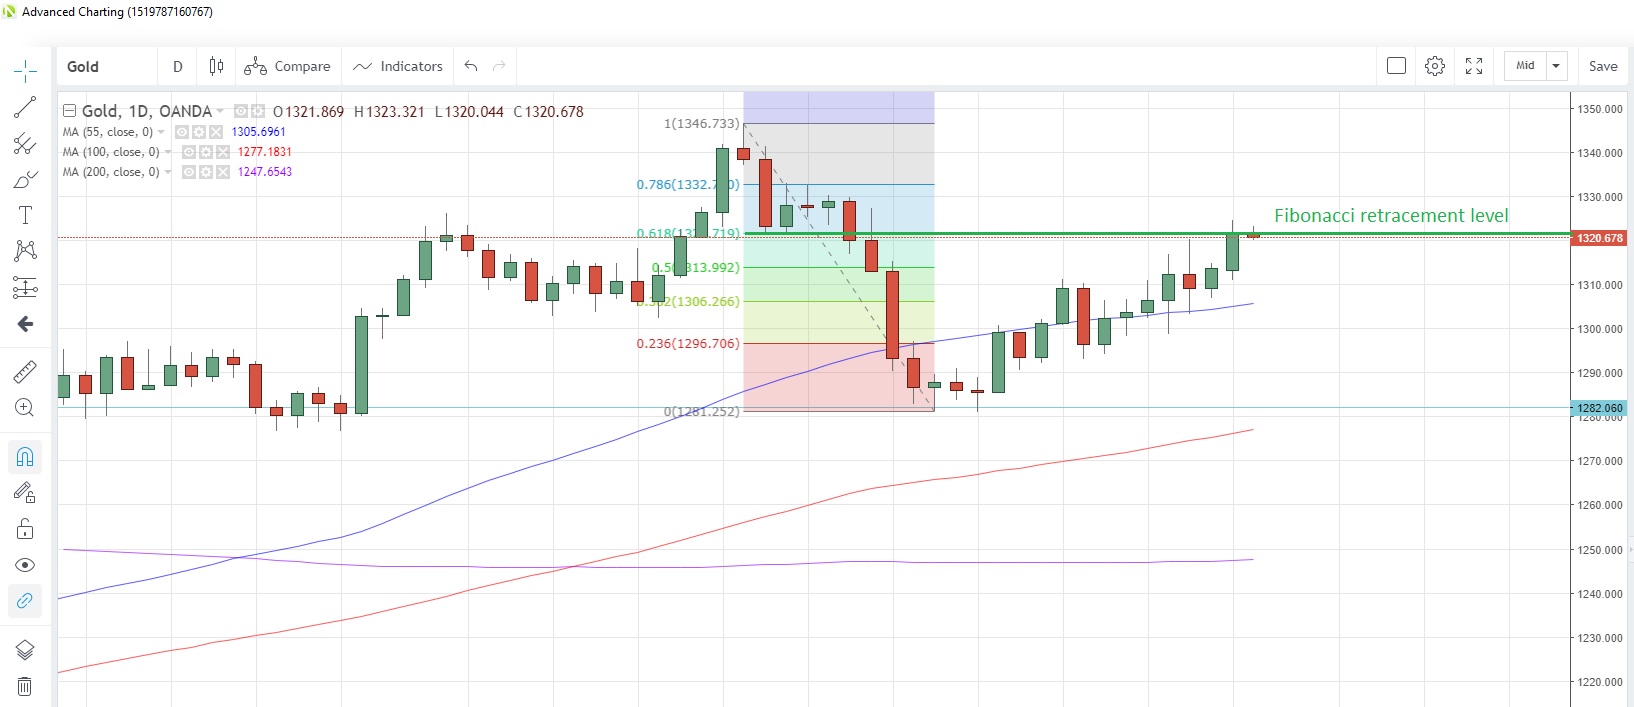
Source: OANDA fxTrade
SILVER has been testing resistance at the 55-day moving average, which is at 15.5847 today, for the past week but has so far failed to close above it. Prices were last above this average on March 1. Speculative investors appear to have been taking note of this failure and reduced net long positions for a third straight week, CFTC data as of March 19 shows. Net long positions are now at the lowest since the week of December 18.
The gold/silver (Mint) ratio has been trading within the parameters of an 84.0 to 85.5 corridor this month and is currently at 85.074.
PALLADIUM traded above the psychological 1,600 mark for the first time last week on continuing shortage concerns. Speculative investors have been using the metal’s current rally to take profit on long positions, as they reduced their net longs for a fourth straight week in the week to March 19. Net long positions are now at the lowest since the week of October 30, according to the latest data from CFTC.
The global shortage is further evidenced by exchange-traded funds reducing their palladium holdings by 625 troy ounces last Friday, Bloomberg reported. However, the 17% drop in car sales in China during February, even though it included the Lunar New Year period, may raise concerns about demand in the future, since China’s push for greener emissions in its automobiles has been one of the major drivers of palladium demand.
Some analysts expect the metal’s bullish run to peter out as the year progresses, according to a recent Bloomberg survey. The average year-end forecast for palladium among poll respondents was about $1,350.
PLATINUM continues to struggle to match palladium’s gains and has traded in an 810-876 band so far this month. It’s now at 858.68. The 55-day moving average at 823.15 is above the 200-day moving average at 822.34 today for the first time since April 30. This so-called golden cross is viewed as a longer-term bullish signal.
Platinum Daily Chart
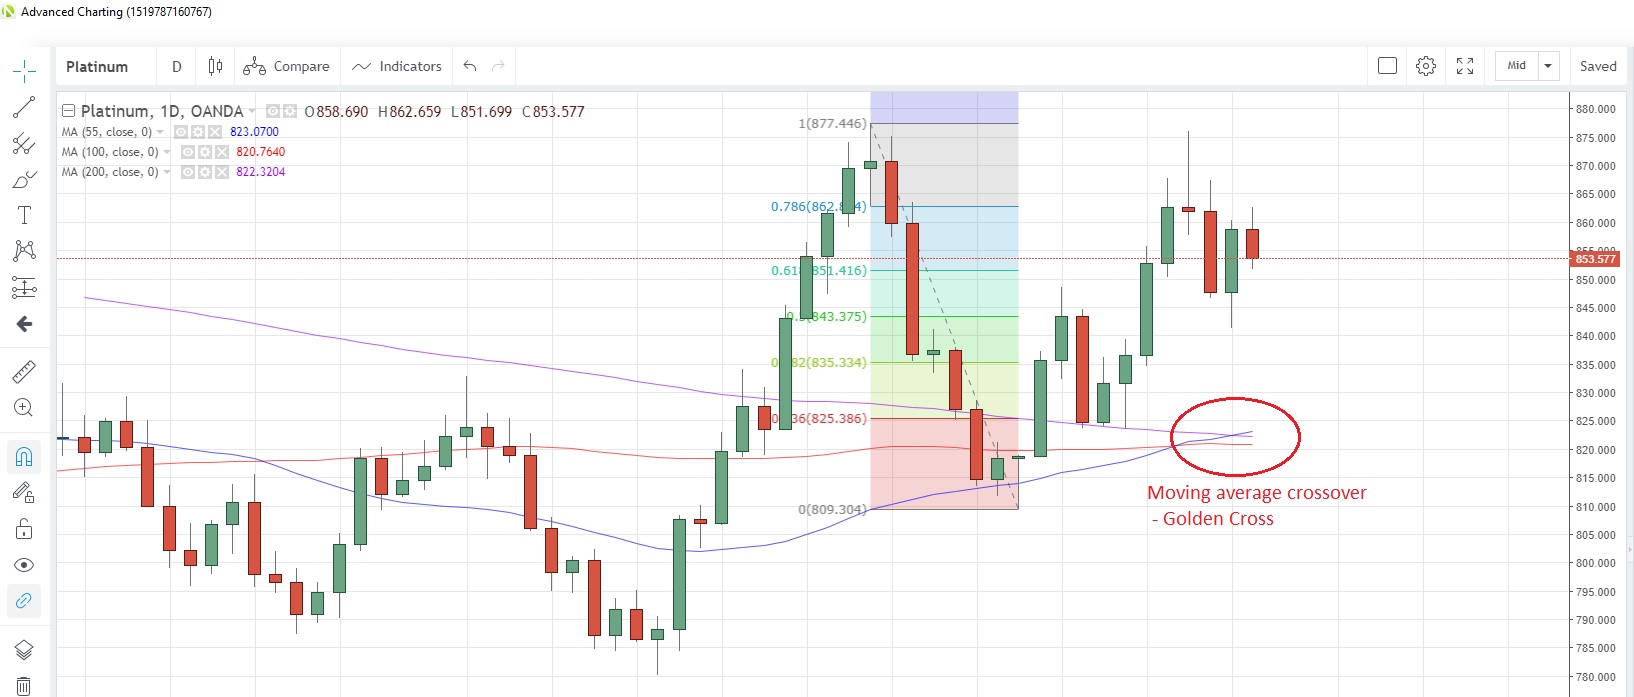
Source: OANDA fxTrade
Base metals
COPPER slipped to the lowest level in five weeks yesterday as global slowdown fears raised the spectre of slowing demand for the industrial metal. The metal touched 2.8265, the lowest since February 19, and is now at 2.8452. The 55-day moving average is at 2.8084 and on a rising trend.
Speculative investors trimmed net longs for a second straight week in the week to March 19, the latest CFTC data shows. China’s ferronickel imports hit an all-time high in January-February, according to China customs data, with imports from Indonesia accounting for a whopping 71% of the total. The same customs data showed copper imports from Chile at a record 789,787 tons in February. Copper stockpiles at the Shanghai Futures Exchange fell by 5,429 tons in the week to March 22.
Energy
CRUDE OIL prices are hovering just below the four-month highs struck last week as OPEC productions cuts continue to influence the supply situation. Speculative accounts are most bullish on oil prices since last October after increasing net long positions for the past five weeks, according to CFTC data. Perhaps they believe that OPEC will win the supply war with the US, with its cuts overcoming the US increases in production. China’s imports of crude oil in February were up 21.6% from a year earlier, according to the China customs data.
The OPEC planned cuts have caused Citibank to raise its oil price forecasts for Brent crude. It increased its Q2 target by $9 to $69 per barrel, its Q3 estimate to $74 per barrel and its Q4 forecast to $72 per barrel.
Crude oil prices have tested the 50% retracement level of the October-December drop at $59.653 and, after one close above the level on March 20, have failed to do so for the past three days. WTI is now at $58.954 with the 200-day moving average at $61.736.
NATURAL GAS has failed to gain any upward momentum despite news that some gas platforms off the coast of Western Australia had been evacuated as a precaution due to the proximity of cyclone Veronica. China’s February LNG imports from the US were down 50% from January, according to the latest data from the China customs bureau.
Natural gas is now at 2.762 and continues to be capped in the near term by the 55-day moving average, which is at 2.886 today. Prices have been below this average since December 24.
Agriculturals
CORN looks poised for its third weekly advance in a row as it heads toward the seven-week high of 3.766. It’s now at 3.722 after climbing for the past five sessions, boosted by news on Friday that US exporters had sold 300,000 tons of corn to China, the biggest deal in five years, which triggered hopes of a pickup in demand. Customs data showed that China’s corn imports in February were up 14.5% from a year earlier at 570,000 tons.
Speculative investors were net buyers for the first time in six weeks in the week to March 9, according to the latest data snapshot from CFTC, though accounts are still carrying net short positions, which are near to the highest since November 2017.
SUGAR has been on a downward path for the last week and yesterday tested support at both the 100-day moving average and rising trendline from September at 0.1239 and 0.1240 respectively. Prices rebounded from the support area but still closed in the red yesterday at 0.12539.
On the supply side, India’s sugar output in the October 1 to March 15 period was up 5.9% y/y at 27.35 million tons, while Russia’s output for the 2019-20 season is seen steady, according to a local producers group.
Sugar Daily Chart
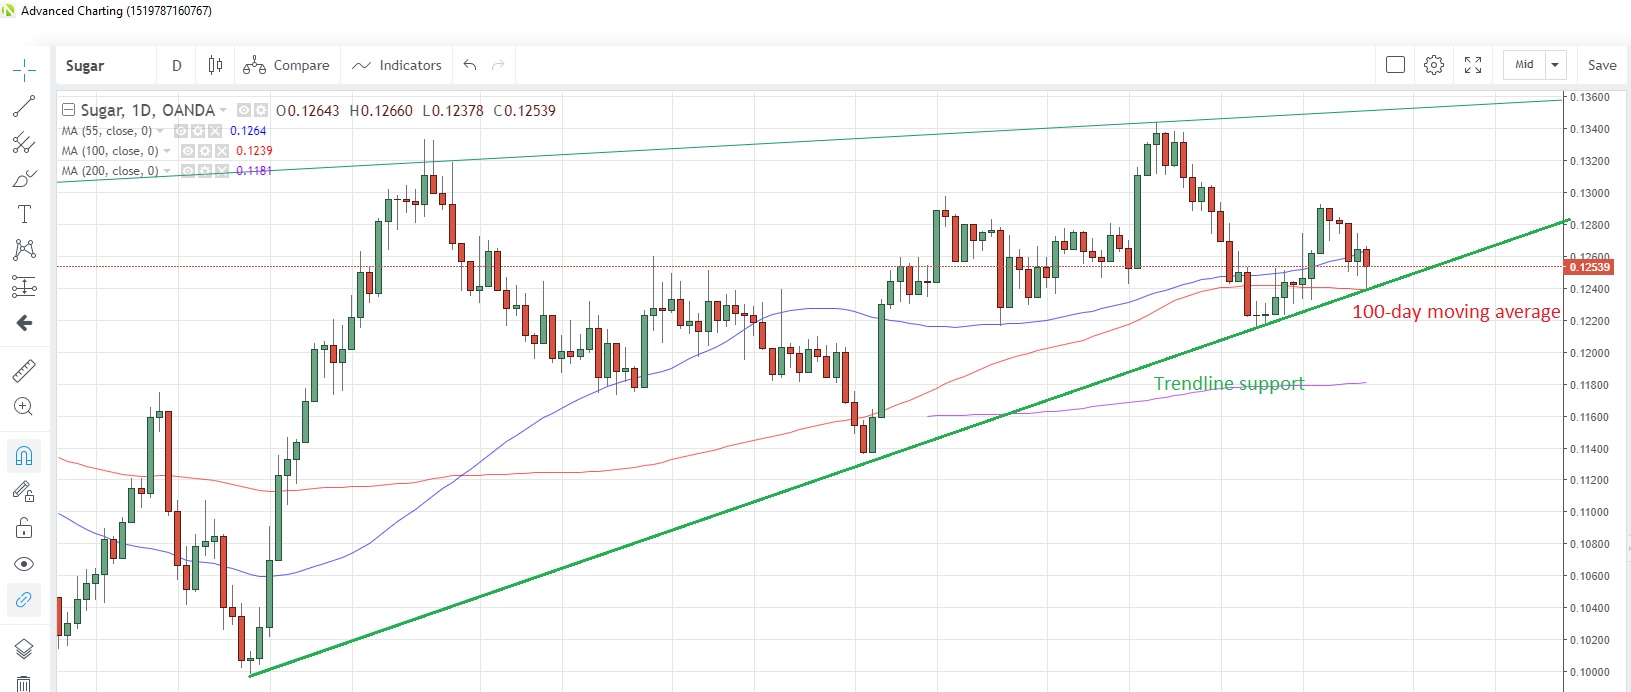
Source: OANDA fxTrade
SOYBEANS have been stuck between the 55-day moving average resistance at 8.9892 and 100-day moving average support at 8.9183 for almost two weeks. With the parameters gradually narrowing, we can expect a breakout either way within the next week. China’s imports of soybeans surged to 907,752 tons, more than five times the total in January, according to the latest China customs data.
WHEAT has been on an upward trend and looks on track to advance for a third straight week this week, if it can convincingly overcome resistance of the 100-week moving average at 4.6650, which successfully capped gains last week. Wheat is now at 4.666. Wheat’s advance has forced speculative investors to trim net short positions for a second straight week, according to CFTC data to March 19.
Content is for general information purposes only. It is not investment advice or a solution to buy or sell securities. Opinions are the authors; not necessarily that of OANDA Business Information & Services, Inc. or any of its affiliates, subsidiaries, officers or directors. If you would like to reproduce or redistribute any of the content found on MarketPulse, an award winning forex, commodities and global indices analysis and news site service produced by OANDA Business Information & Services, Inc., please access the RSS feed or contact us at info@marketpulse.com. Visit https://www.marketpulse.com/ to find out more about the beat of the global markets. © 2023 OANDA Business Information & Services Inc.

Andrew Robinson
Latest posts by Andrew Robinson (see all)
- RBA cuts rates on virus impact - 2 March 2020
- Commodities Weekly: Oil rises first time in eight days - 2 March 2020
- Daily Markets Broadcast 2020-03-03 - 2 March 2020