Please note this will be the final Commodities Weekly for 2018. Publication will restart on Tuesday January 8, 2019.
Concerns about the status of US-China trade talks has seen metals pause their recent rally. Oil markets struggle to benefit from the planned OPEC cuts next year, while the agricultural sector awaits the next trade developments.
Precious metals
PALLADIUM is consolidating after touching record highs last week. The latest rally coincided with palladium’s price rising above that of gold for the first time ever, even though it might have been fleeting. Speculative investors still believe there could be further upside for the precious metal amid rising demand and a global shortage of the commodity. They increased their net long positions for the fifth straight week and net long positioning is now at the highest level since the week of February 27.
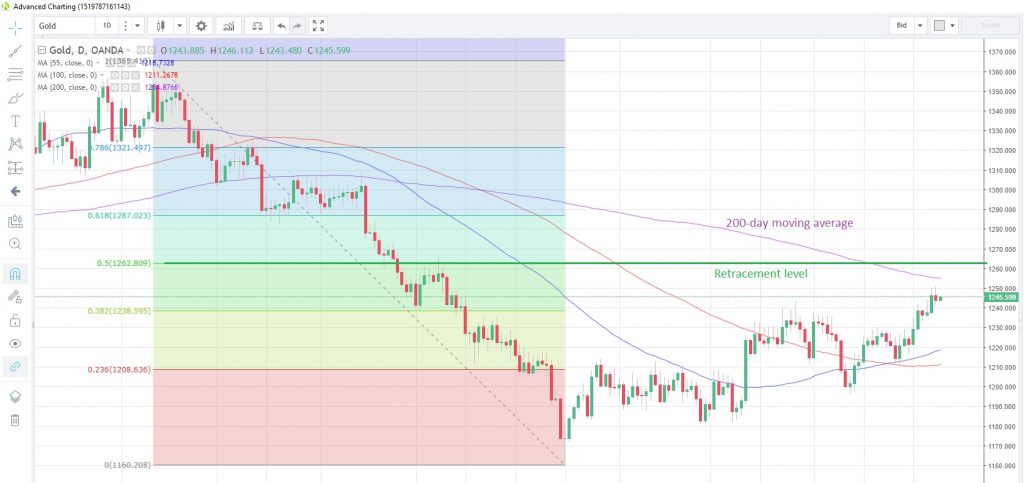
GOLD continues to edge toward the 200-day moving average at 1,255. This moving average has capped prices since June 14 and, with the stochastics momentum indicator above the overbought threshold, could possibly withstand this test once more.
Gold Daily Chart
Speculative investors increased their net long futures positions by more than 47,000 contracts in the week to December 4, according to the latest data snapshot from CFTC. Global Exchange Traded Fund flows have turned positive for 2018 as at end-November, according to a World Gold Council report dated November 30.
SILVER is currently testing the 100-day moving average at 14.572, but has failed to close above it for the past two days. A close above this average would be the first time since June 14 and could ignite a challenge to the October and November highs around 14.905. The gold/silver ratio remains confined within the parameters of the range in the last month, currently at 85.459. Speculative accounts reduced their net short positions to just 635 contracts, the lowest since the week of August 7, according to CFTC data as at December 4.
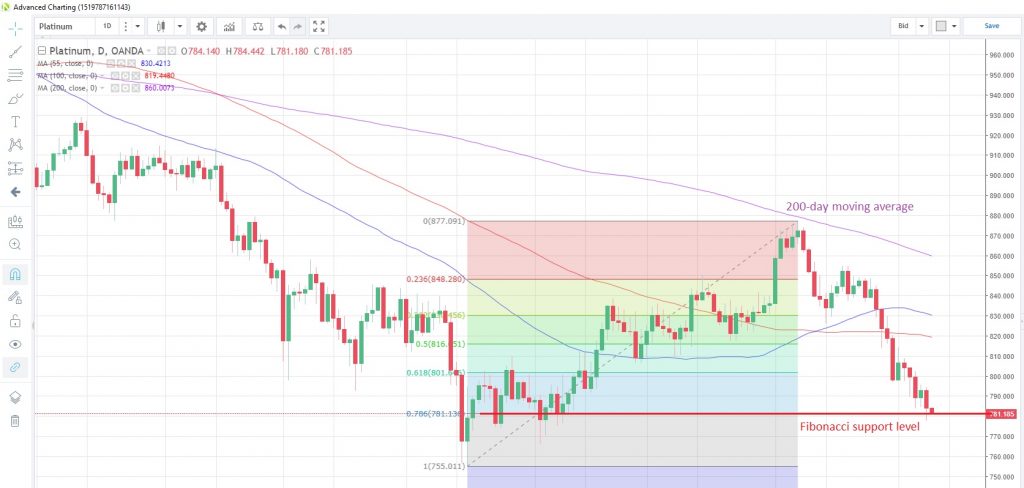
PLATINUM has been on a downward trend since early-November amid waning industrial demand. Prices touched the lowest since September 10 yesterday and are currently testing the 78.6% Fibonacci retracement level of the August to November rally at 781.14. Speculative investors reduced their net long futures positions to the lowest since the week of October 30.
Platinum Daily Chart
Base metals
COPPER is under slight pressure after Chin’s trade numbers for November were published last weekend. Imports showed a hefty decline and this is questioning the demand outlook for copper. China’s copper imports fell 3% from a year earlier to 456,000 tonnes.
Chile’s copper production rose 6% in the January to October period compared to the same period a year ago, the country’s copper commission reported. The increase is attributed to a stronger performance by BHP’s Escondida mine, which upped production by 47% after suffering a strike in the same period last year.
Energy
CRUDE OIL prices are struggling to gain any upward momentum after OPEC and its allies announced a planned reduction in production of 1.2 million barrels per day from January. Prices were given a slight lift this morning after Libya’s National Oil Company declared force majeure on exports from the El Sharara oilfield, which was seized at the weekend by a local militia group, hence affecting supply.
Weak trade data from China at the weekend is also raising questions about the global demand situation going forward into next year. The weekly crude oil stocks data from API has shown an inventory build for the past two weeks and another addition to stockpiles later today would put pressure on the fragile oil price. West Texas Intermediate is now at $51.12, managing to cling on to the $50 handle for the past seven days.
NATURAL GAS prices continue to weigh seasonally low stockpiles against anticipated above-average warmer weather, and are barely changed from a week ago. Stockpiles are about 19% below levels a year ago and about 20% below the five-year average. Inventory data as at November 30 published by EIA showed a drawdown from stockpiles for the third straight week. Another drawdown this week could push prices back toward the 4-1/2 year highs seen in November.
Agriculturals
SOYBEANS are clinging on to gains made after the G-20 meeting a couple of weeks ago. In a post-meeting tweet, President Trump said that China had agreed to buy a “substantial amount” of US agricultural, energy and other products. This has more-or-less been confirmed by China, who said they were preparing to resume imports of US soybeans “soon”, which is generally being interpreted as this month.
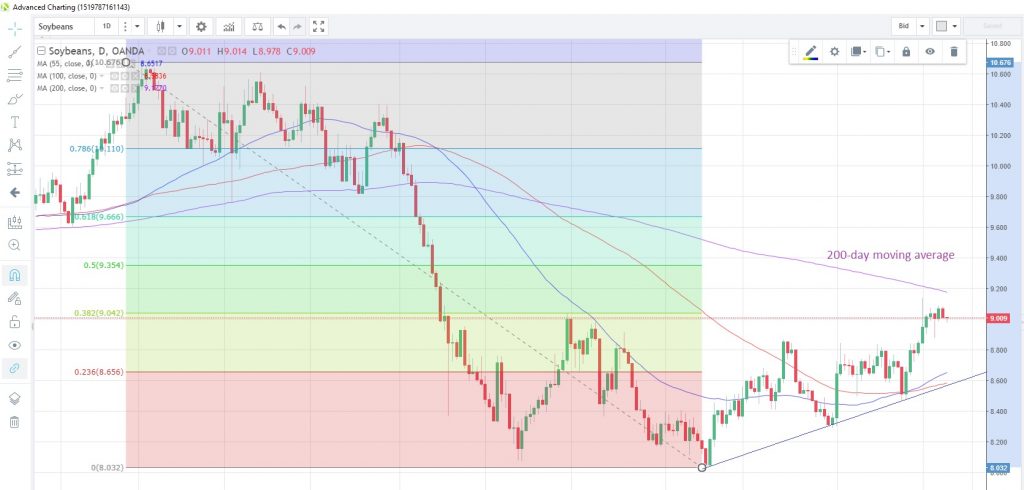
Speculative investors turned their positioning bullish for the first time since July 17, according to the data snapshot from CFTC as at December 4. Net long futures positions are at +8,951 contracts, the most since the week of June 19. Soybeans are now trading at 9.012 after climbing for two straight weeks. The 200-day moving average at 9.177 acts as the first resistance point, and it has capped prices since June 7.
Soybeans Daily Chart
WHEAT is hovering near three-month highs after posting the biggest one-day gain in a month last Friday. Positioning by speculative accounts remained bearish for a second week, the latest data as at December 4 from CFTC shows. The US Department of Agriculture reported that US shipments of wheat had increased in the week to November 29. Prices displayed muted reaction to news this morning that China and the US had discussed the road map for the next stage of their trade talks.
CORN prices rose for the second consecutive week last week amid an anticipated increase in demand for methanol production. The US Department of Agriculture has forecast that China’s methanol production this year will be 6% higher than a year ago, according to its Foreign Agricultural Service. This is all seen a part of China’s drive to conserve resources, improve air quality and reduce its dependency on fossil fuels. Speculative accounts increased their net long futures positions in the week to December 4, and they are now at the highest since the week of November 6.
SUGAR continues to hover above the 55-day moving average at 0.1202, though upward momentum is not very strong. Sugar prices have closed above this moving average since November 28 and are currently straddling the 55-week moving average at 0.1222. Speculative positioning remains bullish, as it has been for the last two months, according to the latest CFTC data.
Content is for general information purposes only. It is not investment advice or a solution to buy or sell securities. Opinions are the authors; not necessarily that of OANDA Business Information & Services, Inc. or any of its affiliates, subsidiaries, officers or directors. If you would like to reproduce or redistribute any of the content found on MarketPulse, an award winning forex, commodities and global indices analysis and news site service produced by OANDA Business Information & Services, Inc., please access the RSS feed or contact us at info@marketpulse.com. Visit https://www.marketpulse.com/ to find out more about the beat of the global markets. © 2023 OANDA Business Information & Services Inc.


