AUD/USD hits lowest in 19-months
Further signs that China’s economy may be slowing helped push the Australian dollar to its lowest level since January 2017, with the antipodean currency poised for its fifth consecutive daily loss. The Aussie is trading about 7.4% lower versus the US dollar since the beginning of the year. It could not gain any traction despite another up day for the Turkish lira, which rose as much as 5.8%.
Aussie was probably more affected by local and China data rather than the sentiment from emerging currencies. Fixed asset investment rose 5.5% y/y from January to July in China, less than the 6.0% forecast and the smallest increase since data began in early 2008.
Elsewhere, in line with USD/TRY’s movements, USD/MXN rose 0.7% while USD/SGD, a good barometer of the dollar’s direction, rose 0.1% to 1.3800, its highest level in just over a year.
AUD/USD Daily Chart
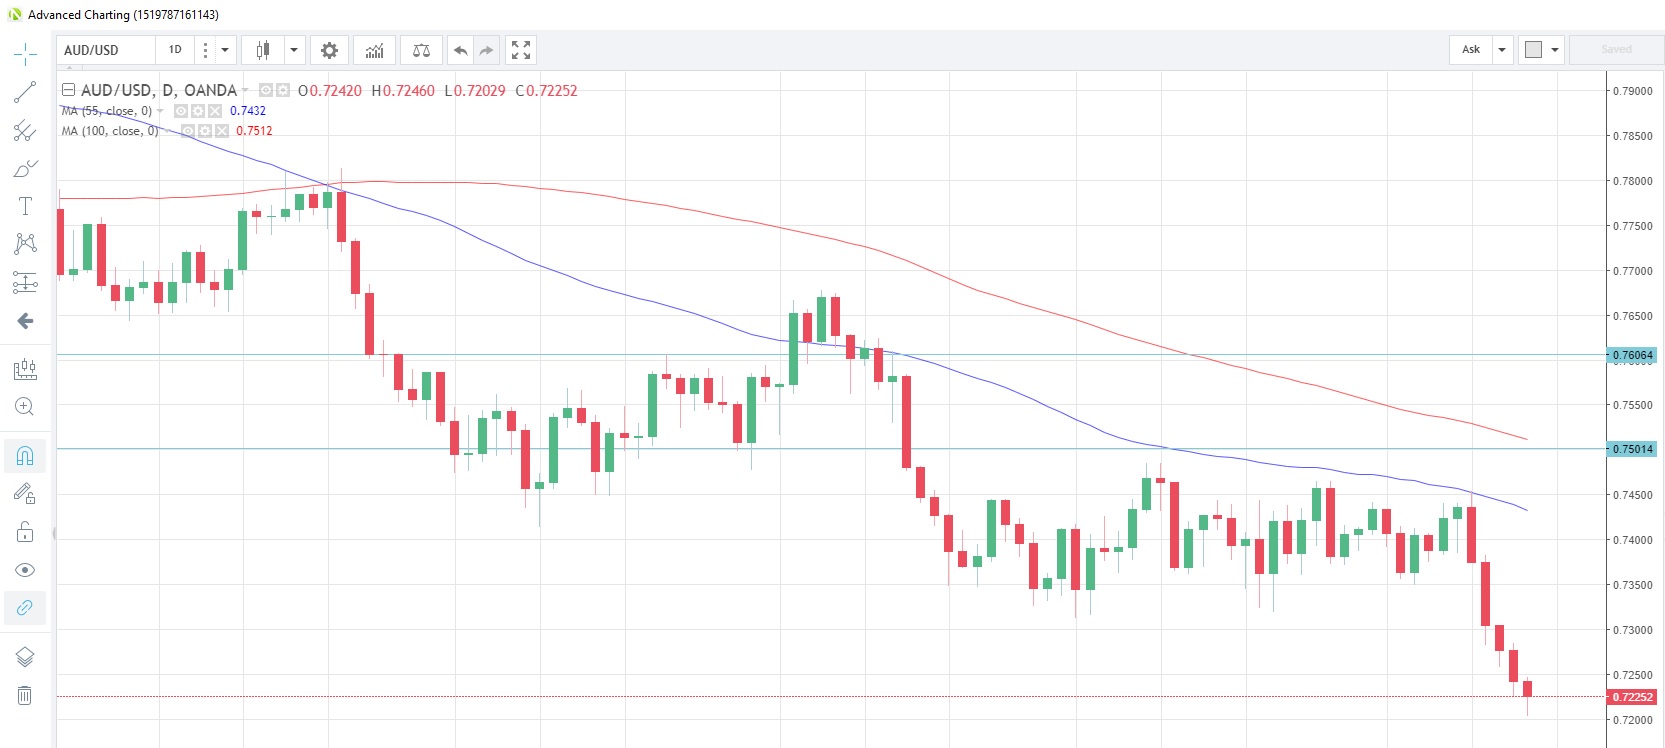
Source: Oanda fxTrade
Australia wages growth hits forecast
Wages growth in Australia remains slow, with the county’s wage price index rising 0.6% q/q in Q2, a slight pickup from the 0.5% rate in Q1 though has consistently held in the 0.4% to 0.6% range for the past four years. Slow wages growth (combined with high household debt) has been cited by the RBA as a reason for keeping interest rates at record lows. Consumer confidence, as measured by the Westpac index was down 2.3% in August after registering and improvement of 3.9% the previous month.
UK inflation seen ticking higher
UK producer and consumer prices are on tap today together with DCLG’s reading of house prices in July. Consumer prices are expected to rise 2.5% y/y, according to the latest survey of economists, as the Bank of England citied taming consistently high inflation as one of the reasons for hiking rates earlier this month. An above-forecast reading today will no doubt stir the hawks into talking about the next BOE hike, which could help the Pound halt a 10-day losing streak which has seen it drop to a 14-month low earlier today.
GBP/USD Daily Chart
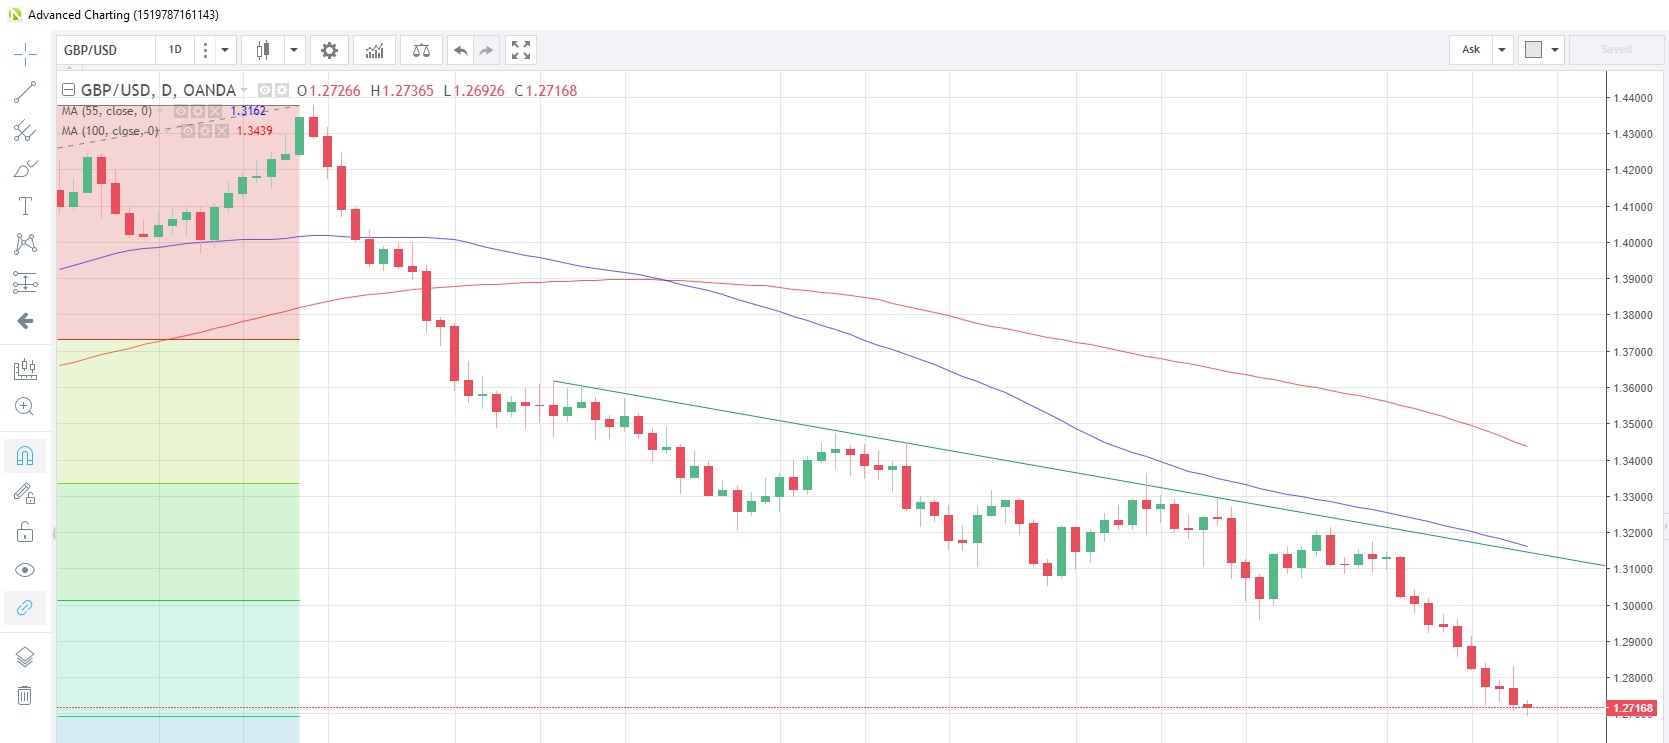
Source: Oanda fxTrade
The US session features US retail sales, the industrial production/capacity utilization combo and business inventories. Closing the session we see net inflows/outflows of financial resources in the US with the monthly TIC flows data.
The full MarketPulse data calendar can be viewed here: https://www.marketpulse.com/economic-events/
Content is for general information purposes only. It is not investment advice or a solution to buy or sell securities. Opinions are the authors; not necessarily that of OANDA Business Information & Services, Inc. or any of its affiliates, subsidiaries, officers or directors. If you would like to reproduce or redistribute any of the content found on MarketPulse, an award winning forex, commodities and global indices analysis and news site service produced by OANDA Business Information & Services, Inc., please access the RSS feed or contact us at info@marketpulse.com. Visit https://www.marketpulse.com/ to find out more about the beat of the global markets. © 2023 OANDA Business Information & Services Inc.

Andrew Robinson
Latest posts by Andrew Robinson (see all)
- RBA cuts rates on virus impact - 2 March 2020
- Commodities Weekly: Oil rises first time in eight days - 2 March 2020
- Daily Markets Broadcast 2020-03-03 - 2 March 2020