The risk that the ongoing trade wars could escalate to such an extent that all $500 billion worth of Chinese exports to the US could be subject to some form of tariff is causing some concern among investors. At the recent G-20 summit in Buenos Aires, the consensus was that the trade spat is a major threat to global growth going forward, even if it appears robust at the moment.
Industrial metals have been on the defensive for the past two months while gold continues to struggle to uphold its safe haven status as the US dollar reigns supreme. Crude oil is consolidating after last week’s 10% drop while the agricultural sector is attempting a rebound after a two-month bear phase.
Base metals
COPPER prices remain subdued amid global demand concerns. The base metal has been in virtual freefall since early-June, and last Thursday hit its lowest level since July 14 last year. It’s now trading at 2.7249 with possible sign of bullish momentum divergence unfolding on the daily chart.
Copper Daily Chart
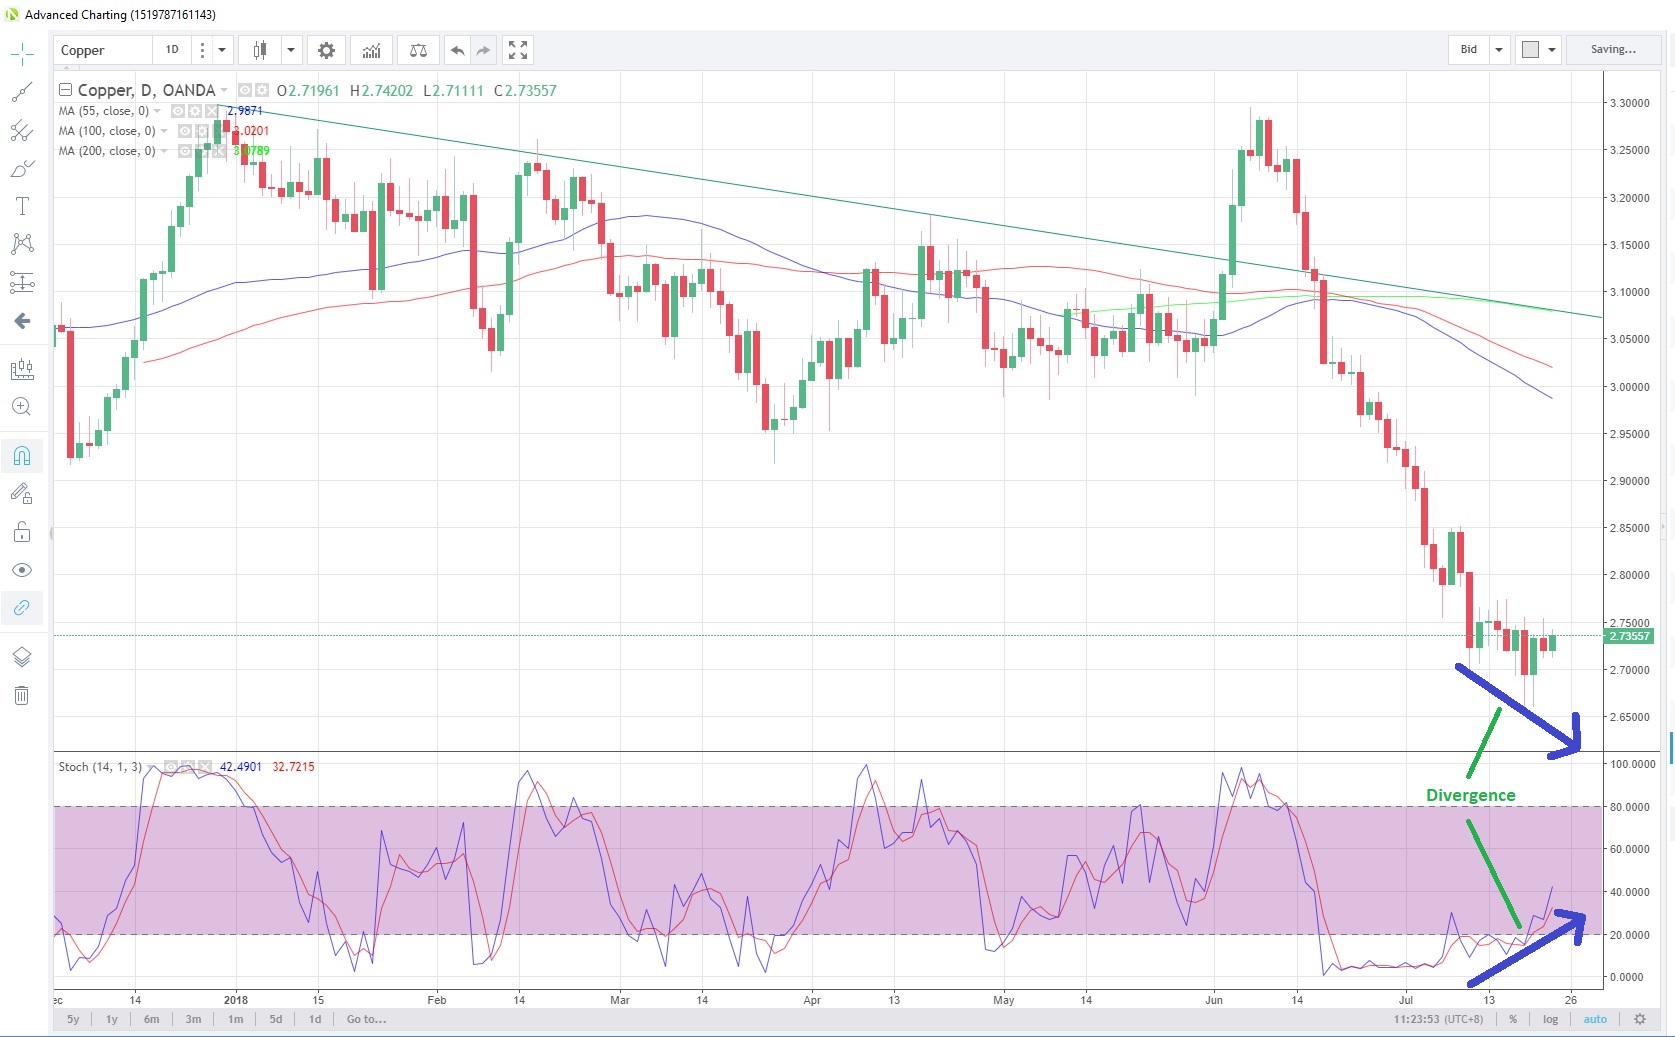
Bullish Divergence Daily Chart Source: Oanda fxTrade
Negotiations surrounding the strike at Chile’s Escondida copper mine, the world’s largest, are deadlocked without signs of an imminent agreement as the current contract expires in less than a week. Additional labor tensions may be brewing at another mine in Chile, Lumina Copper’s Caserones mine, according to a Reuters report late last week.
Precious metals
GOLD remains under pressure even with all the trade war and geopolitical tensions rising around the globe. The war of words between Trump and Iranian President Hassan Rouhani, where Trump tweeted to Rouhani on Sunday to “NEVER, EVER THREATEN THE UNITED STATES AGAIN” after Rouhani said that hostile U.S. policies towards Tehran could lead to “the mother of all wars”, has helped to lift prices only briefly. The metal is currently trading at 1,223.74.
According to the latest Commitment of Traders report as at July 17, speculative short positioning is at its highest since January 2016. It may be interesting to note that, at such extreme positioning, gold rose a total of 19% during January and February of 2016 from the near-term low in December 2015.
There also appears to be no respite for SILVER, which is also hovering near one-year lows though the Mint (gold/silver) ratio has been edging up to 2-1/2 month high of 79.942.
Gold/Silver (Mint) Ratio
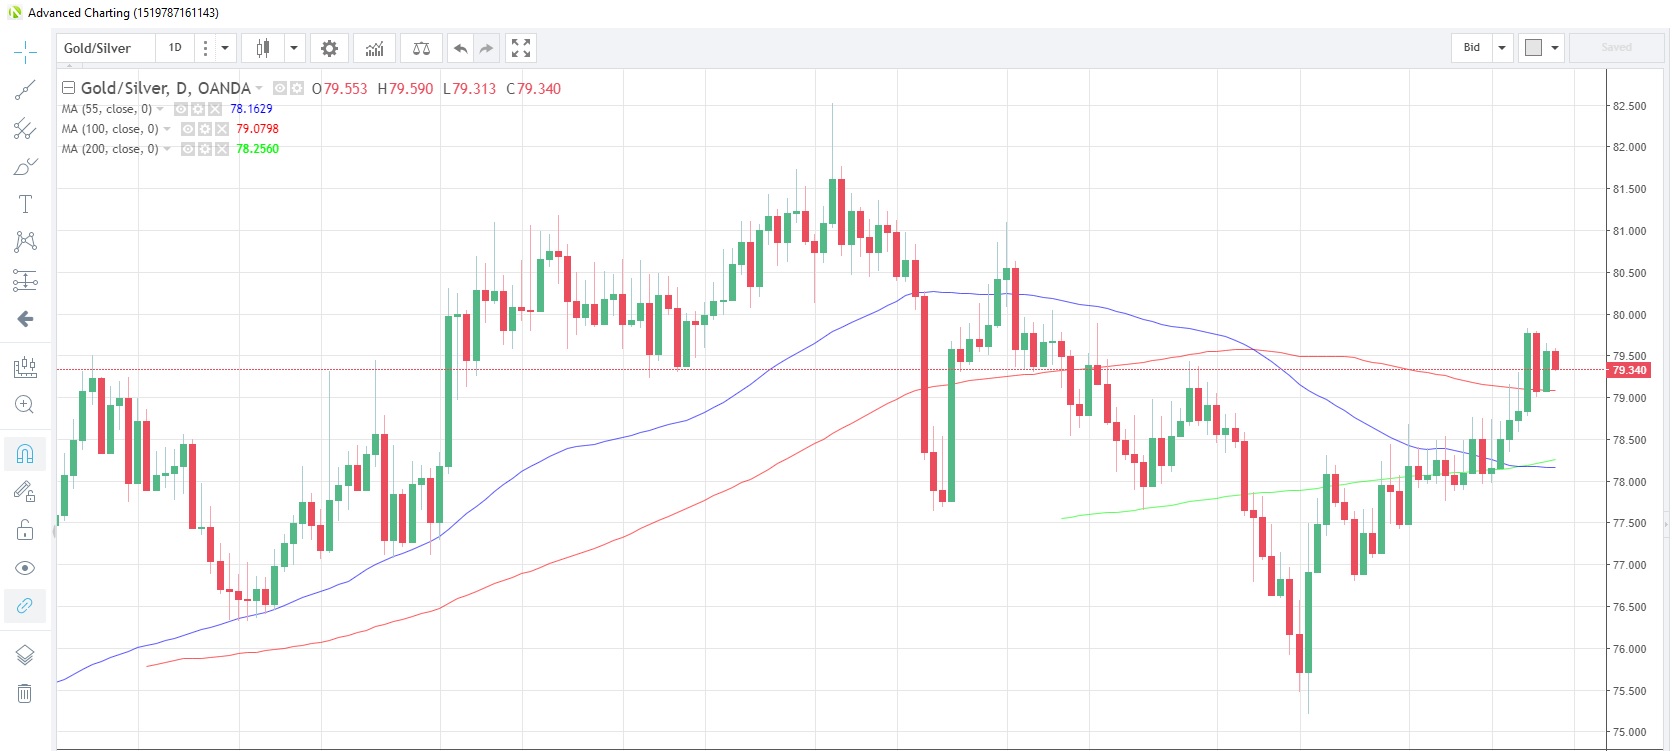
Source: Oanda fxTrade
PLATINUM has rebounded strongly after another test of the sub-800 levels. It touched 793.393 last Thursday, the lowest since December 2008, but has since recovered to 831.87. CFTC data as at July 17 showed that money managers were net sellers of 783 contracts during that week, and overall short positions exceeded long ones by 29,493 contracts.
PALLADIUM has managed to snap a five-day losing streak and has bounced 6.3% to 915.27 from the near-term bottom last Thursday. Strong resistance is to be found in the 968.60-971.39 window, which represents the 55- and 100-day moving averages, respectively
Energy
NATURAL GAS is stuck in the lower half of its three-month 2.60-3.00 trading band with slack demand during the summer months likely to keep it pegged lower. A Reuters report yesterday also highlighted that the world’s largest oil companies are pumping more natural gas than ever before, satiating rising global demand for greener fuels. Major companies have upped output by a collective 15% in the past decade, thanks to better technology and lower costs, the report states.
CRUDE OIL prices have edged lower this week after last week’s EIA storage data showed a surprise build of 5.8 million barrels after previous week’s huge 12.6 million barrel drawdown, the largest since September 2016. WTI is currently trading at 68.557 while the Brent/WTI spread is holding at about 4 pips.
In other news, Iran has overtaken Saudi Arabia as India’s number two oil supplier in the April-June quarter, India’s oil minister said on Monday, while Iraq remains top of the list of India’s crude suppliers.
Oil Drops After Oversupply Concerns Take Over
Agriculturals
SUGAR appears to be building a near-term base as the commodity consolidates and holds above last week’s 2-1/2 year low of 0.1063. It is now trading at 0.1086.
In a report last week, the US Department of Agriculture raised global sugar production forecasts for the 2017/18 marketing year, as a result of favourable growing conditions in South and Southeast Asia, increasing the estimated global production surplus to its highest level in several decades.
Bulls will be keeping an eye on weather patterns in the second half of the year amid concerns that another El Nino system in Asia could strike. Last week the Indian government approved an increase in prices that sugar mills must pay for sugar cane by about 7.8% effective October 1.
CORN is also staging a recovery from 22-month lows, though is still lower on the month, the third consecutive monthly decline. In their July World Agriculture Stocks and Demand Estimates (WASDE) report, USDA pegged new crop carryout on corn at 1.55 billion bushels, which is considered a low figure for this time of year.
Last week’s rally in SOYBEANS appears to have come to an end, with crop looking set to post its second straight day of declines. One of the first imports to be subjected to Chinese tariffs, soybeans have been trading with a softer bias since end-May. However, last week’s low of 8.074 should provide near-term support while the July 6 high of 8.761 will be the next resistance point.
WHEAT touched its highest level in six weeks yesterday rising just above the 5.0 handle. In the latest WASDE report, the US Department of Agriculture raised US 2018/19 wheat supplies by 74 million bushels on increased beginning stocks and higher production. For the 2018/19 period the forecast for US wheat production was also raised 54 million bushels to 1.88 billion. Outside of the US, it saw lower production out of the EU, Australia and Russia totaling 9.3 million tons.
Content is for general information purposes only. It is not investment advice or a solution to buy or sell securities. Opinions are the authors; not necessarily that of OANDA Business Information & Services, Inc. or any of its affiliates, subsidiaries, officers or directors. If you would like to reproduce or redistribute any of the content found on MarketPulse, an award winning forex, commodities and global indices analysis and news site service produced by OANDA Business Information & Services, Inc., please access the RSS feed or contact us at info@marketpulse.com. Visit https://www.marketpulse.com/ to find out more about the beat of the global markets. © 2023 OANDA Business Information & Services Inc.

Andrew Robinson
Latest posts by Andrew Robinson (see all)
- RBA cuts rates on virus impact - 2 March 2020
- Commodities Weekly: Oil rises first time in eight days - 2 March 2020
- Daily Markets Broadcast 2020-03-03 - 2 March 2020