Crude marks time in Asian trading, after last night’s API inventory numbers had oil skidding on the shale.
Heading into my 50th birthday next week, I am certainly feeling like the old man of the sea sometimes in this big data, analytics on steroids era. Here in the financial markets, generations of bright young things arrive on a regular basis with more computing power, analytics and algo’s (the catch-all terminology for any sorted of coded computer programme it seems) promising “this time its different.” And in all fairness at some stage, they will probably be right.
Call me old-fashioned if you wish, but after all these years, certain things make nervous in trading. Call it my inbuilt common-sense, trading algo. Headlines this week such as “hedge funds increase longs in oil” and “record long positions in crude futures” usually make the cynic in me very nervous indeed. I have never liked crowds, particularly in trades. Running with the herd in the markets in no bad thing, but it is important to recognise when it’s running towards a cliff and that perhaps it’s better to take your chances with the lions.
That by the way, is a timeless lesson of trading.
Crude Oil delivered just such a lesson last night as the American Petroleum Institute (API) delivered a Goliath crude inventory number of 14.2 million barrels. The second highest on record. The reaction was predictable, as the herd, already nervous from the previous day price action, and ranging markets, turned en masse and headed for the cliff door. Spot Brent and WTI broke support at $54.50 and $52.10 respectively to finish some 2.5+% down for the day.
Asia has marked time since with some early losses being clawed back to be flat for the session. However, more event risk looms tonight in the shape of U.S Energy Information Administration (EIA) Crude Inventory numbers. Last week was a blockbuster 6.5 million barrel increase and it tonight’s number confirms the API figure (they don’t have a linear relationship), then we can expect another culling of the oil bull herd.
Shale is clearly the culprit here. Shale producers are required to hedge a lot more of their forward production these days by selling the forward futures dates. (it’s a bank financing thing.) This has meant that even as OPEC’s cuts has supported the downside in oil prices, there has been relentless selling by U.S. Shale on the top. Hence if we think $50 to $55 as a broad January range you can start to see why. It was really a matter of who blinks first.
If we dig into the Baker Hughes Rig Count 3rd February Report here, we can see where the damage is being done. A quick look at the North American Rig Count Summary reveals.
- Land-based rigs up 162 to 705 from a year ago.
- Horizontal (shale) rigs up 138 to 596 from a year ago.
- Texas-based rigs up 93 to 355 from a year ago.
Without going into the details, all you need to know is that Texas is the centre of U.S. shale at the moment with an extensive infrastructure in place to move that pumped oil to refineries.
So U.S. shale is ramping up at a rate of knots and appears to be finally subsuming the effects of the cuts in production from OPEC. Of course, the key going forward will be what shale’s breakeven is. I am sure the oil industry in America has plenty of bright young things as well. Their algos won’t be making shale more expensive to produce!
Turning to more short term matters though on the charts,
Brent
Brent now has resistance at the breakdown point at $54.50 and then the $56.25/50 region. Support lies at $52.50 and then the $51.25/50 area, some daily lows and the 100-day moving average.
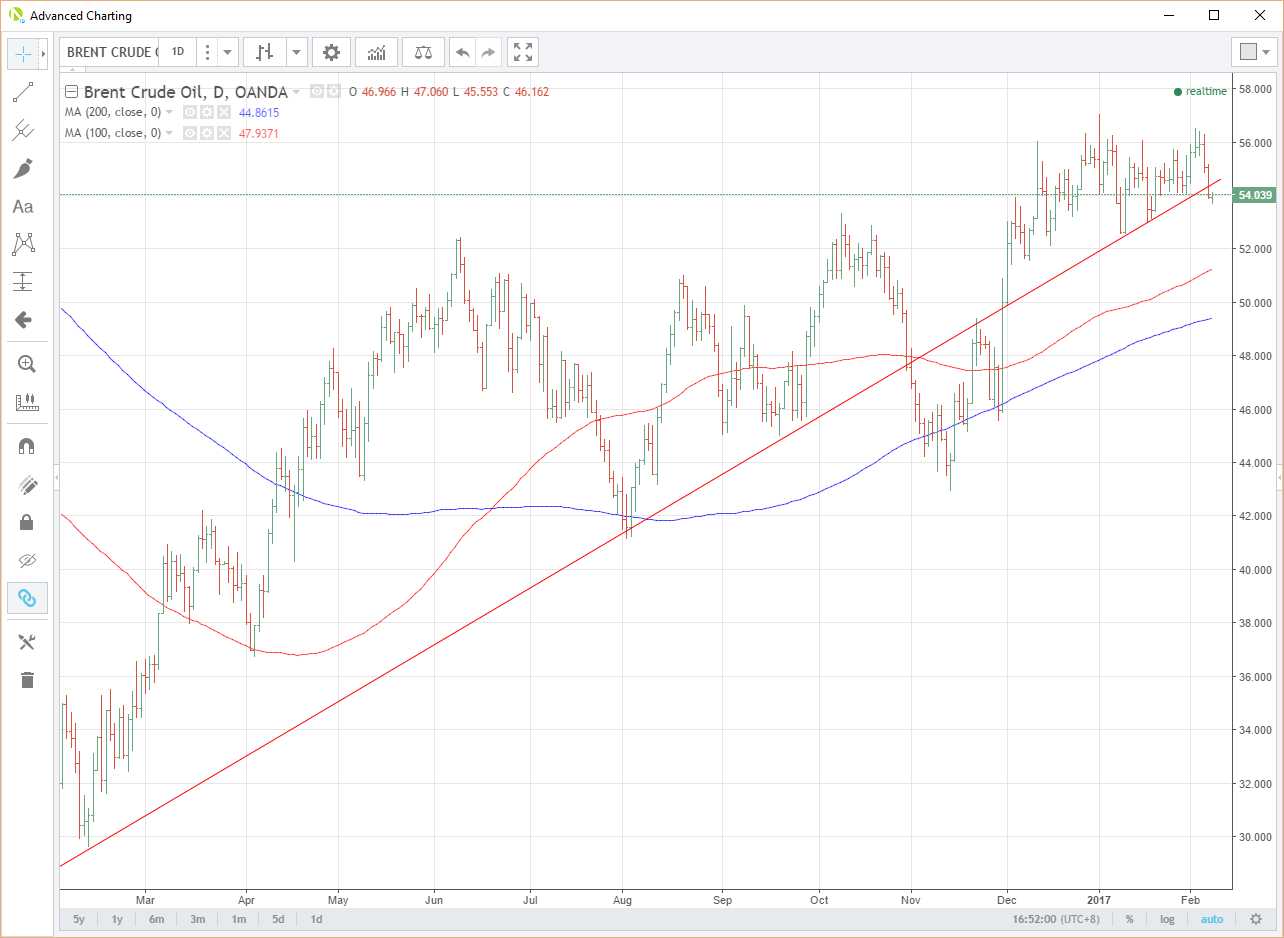
Brent Daily
WTI
Resistance is at the breakdown point, $52.10, followed by $52.80 and $53.80. Support lies at $50.35 and then $49.50, the 100-day moving average.
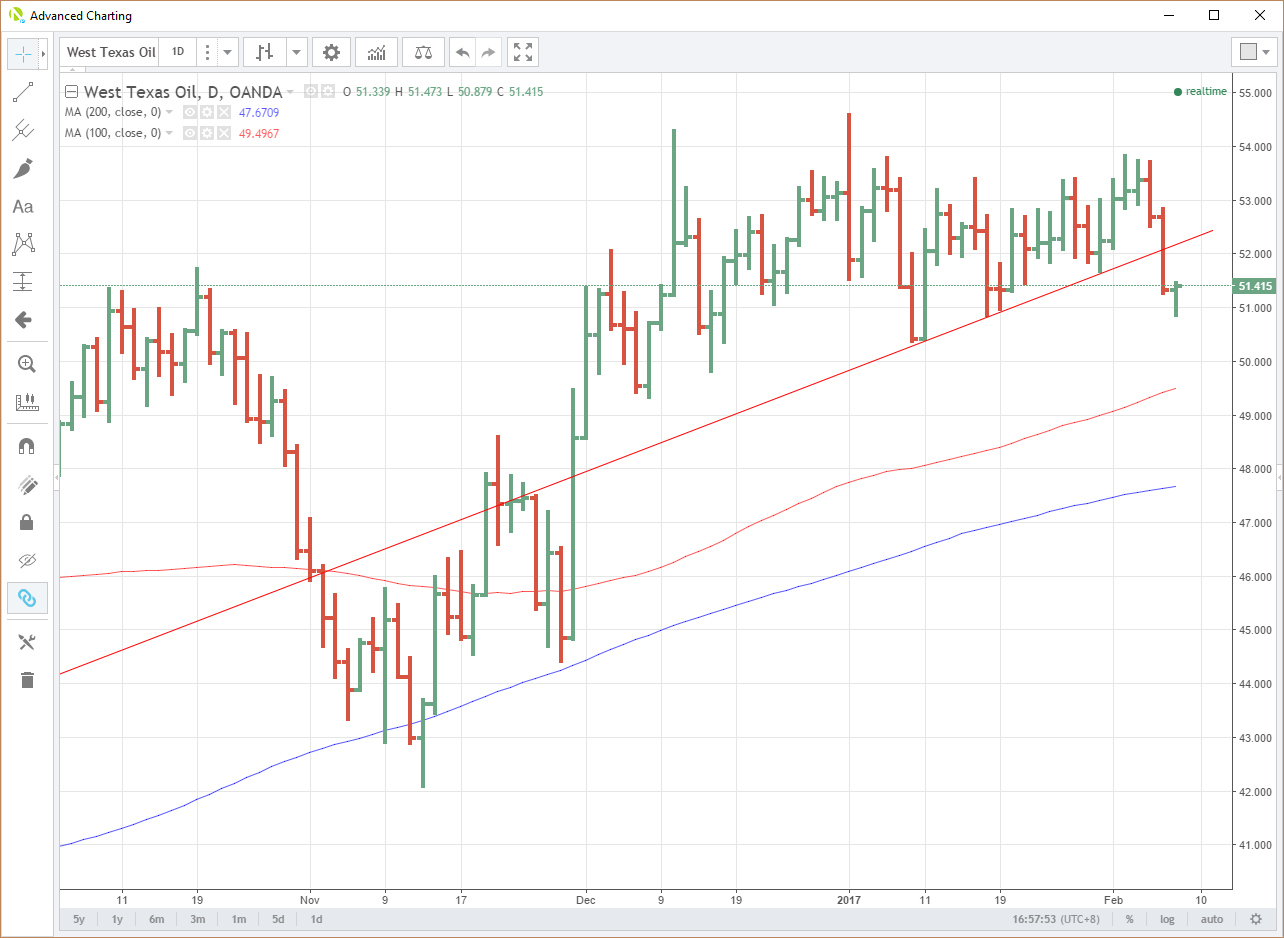
WTI Daily
Summary
Short and sweet really. The EIA Crude Inventory numbers tonight are the key! There could be more long position squaring ahead of this as traders take their chances with the lions. A big number may well result in the herd heading for the stop loss cliff.
Content is for general information purposes only. It is not investment advice or a solution to buy or sell securities. Opinions are the authors; not necessarily that of OANDA Business Information & Services, Inc. or any of its affiliates, subsidiaries, officers or directors. If you would like to reproduce or redistribute any of the content found on MarketPulse, an award winning forex, commodities and global indices analysis and news site service produced by OANDA Business Information & Services, Inc., please access the RSS feed or contact us at info@marketpulse.com. Visit https://www.marketpulse.com/ to find out more about the beat of the global markets. © 2023 OANDA Business Information & Services Inc.
Jeffrey Halley
Latest posts by Jeffrey Halley (see all)
- Oil slides, gold rally continues - 5 August 2022
- US dollar retreat continues - 5 August 2022
- Pelosi relief rally in Asia - 5 August 2022